博文
美国额外死亡人数剧增
||
美国额外死亡人数剧增
诸平
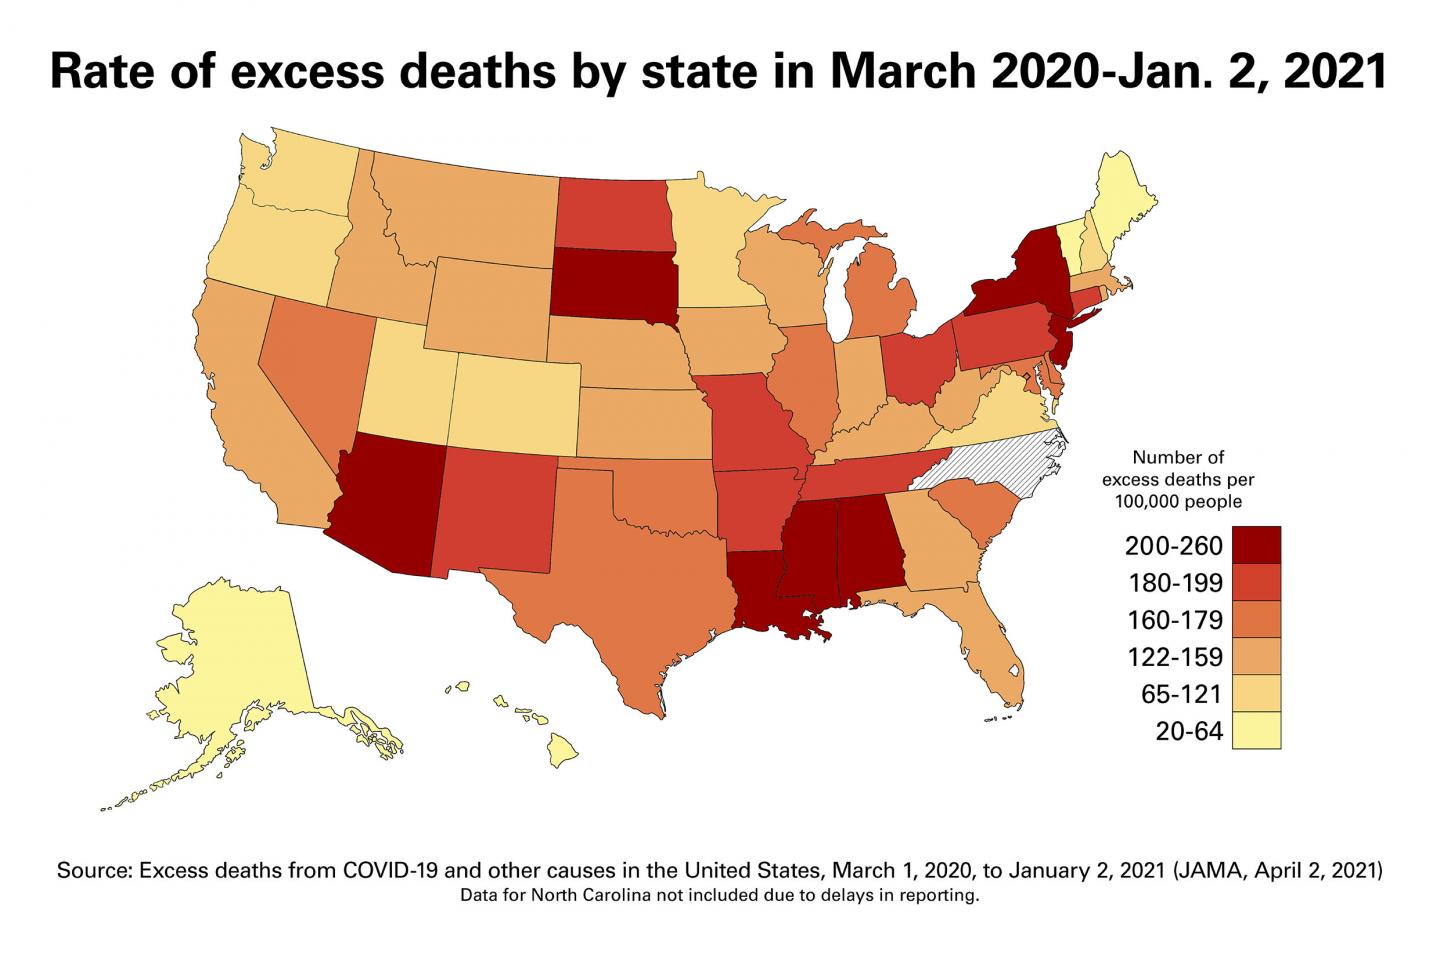
据美国弗吉尼亚联邦大学(Virginia Commonwealth University简称VCU)2021年4月2日提供的研究新闻报道,通常情况下,美国的死亡人数每年变化不到2%;但是2020年,美国的年死亡人数增长到接近23%。2020年3月至2021年1月2日,美国各州的额外死亡人数见图示。由VCU领导的在《美国医学会杂志》(JAMA)发表的研究发现,美国黑人的人均额外死亡率最高,新冠疫情(COVID-19)和其他原因造成区域性额外高死亡率更高。
弗吉尼亚联邦大学(VCU)的研究人员对美国50个州的额外死亡趋势分析发现,2020年夏季和初冬南部和西部的新冠疫情蔓延,病例持续激增导致区域性额外死亡率的增加,既有COVID-19疫情元素影响,也有其他原因影响。但是,研究者的最新研究指出,在2020年,美国黑人(Black Americans)在任何种族或族裔群体中的人均额外死亡率最高。相关研究结果于2021年4月2日已经在《美国医学会杂志》(Journal of the American Medical Association简称JAMA)杂志网站发表——Steven H. Woolf, Derek A. Chapman, Roy T. Sabo, Emily B. Zimmerman. Excess Deaths From COVID-19 and Other Causes in the US, March 1, 2020, to January 2, 2021. JAMA. Published online April 2, 2021. doi:10.1001/jama.2021.5199
在《美国医学会杂志》上发表的这项研究,提供了2020年最后10个月的最新数据,该数据显示了2020年死于流感大流行影响—超过了COVID-19死亡人数—哪个州和哪些种族受到的冲击最为严重。
VCU社会与健康中心(VCU's Center on Society and Health)名誉主席、该研究通讯作者及项目负责人史蒂芬·伍尔夫(Steven Woolf)表示,超额死亡率(或高于过去五年平均水平所预期的死亡人数)通常是一致的,每年之间波动1%~2%。从2020年3月1日到2021年1月2日,在COVID-19和其他原因导致的死亡人数的推动下,美国全国各地的超额死亡人数惊人地增长了22.9%,各地区在不同时期经历了激增。
史蒂芬·伍尔夫说:“ COVID-19大约占我们正在计算的超额死亡人数的72%,这与我们之前的研究相似。公开报告的COVID-19死亡人数与超额死亡总数之间存在相当大的差距,但是,实际上美国已经经历过了。”在此期间,美国全国522368例额外死亡中,其他28%的人可能实际上是由COVID-19造成的,即使由于报告问题,该病毒未被列在死亡证明上。
但是史蒂芬·伍尔夫说,由大流行病引起的干扰是导致28%的额外死亡的另一原因,而这并非归因于COVID-19。例如,在突发事件(如心脏病发作)中,由于没有寻求或没有得到足够的护理而导致死亡,经历慢性疾病(如糖尿病)的致命并发症,或面临导致自杀或药物过量的行为健康危机而导致死亡。
VCU医学院家庭医学和人口健康系( Department of Family Medicine and Population Health at the VCU School of Medicine)教授史蒂芬·伍尔夫说:“所有这三个类别都可能导致并非感染COVID-19的人的死亡人数增加,但其生命基本上是由大流行病导致死亡的。”
史蒂芬·伍尔夫和他的合著者在论文中写道,非西班牙裔黑人个体中的超额死亡比例(16.9%)超过了他们在美国人口中的比例(12.5%),这反映了COVID-19和其他大流行病死亡原因造成的死亡率的种族差异。美国黑人的超额死亡率高于非西班牙裔白人或西班牙裔人口的超额死亡率。
史蒂芬·伍尔夫表示,由于越来越多的证据表明,有色人种死于COVID-19的风险增加,他的团队有目的地根据种族和民族来分析这些信息。
VCU的史蒂芬·伍尔夫表示:“我们发现,在美国黑人中,额外死亡的人数不成比例。” “当然,这与关于COVID-19的证据是一致的,但同时也表明,在美籍非裔人群中,除COVID-19以外的某些情况造成的额外死亡也以较高的比率发生。”
在美国不同地区,死亡人数激增的趋势各不相同。东北各州,如纽约(New York)和新泽西州(New Jersey),是大流行病的首发灾区之一。史蒂芬·伍尔夫说,他们的流行病曲线看起来像是大写的“A”,由于严格的限制措施,四月份达到峰值,并在八周内迅速回到基线。但是在其他州,超额死亡人数的增加持续了更长的时间,这些州提早取消了限制,并在今年晚些时候受到了沉重打击。史蒂芬·伍尔夫列举了一些州长做出经济或政治原因的决定,以弱势地接受或劝阻诸如戴口罩之类的大流行病控制措施。
史蒂芬·伍尔夫说:“他们说,他们早日开放以挽救经济。悲剧是,该政策不仅使更多人丧生,而且通过延长流感大流行的持续时间实际上损害了他们的经济。” “我们国家必须从COVID-19上吸取的重要教训之一是,人们的健康与经济紧密相连。如果没有彼此,就无法实现真正的挽救。”
根据这项研究的数据,人均超额死亡率最高的10个州是密西西比州(Mississippi)、新泽西州(New Jersey)、纽约州(New York)、亚利桑那州(Arizona)、阿拉巴马州(Alabama)、路易斯安那州(Louisiana)、南达科他州(South Dakota)、新墨西哥州(New Mexico)、北达科他州(North Dakota)以及俄亥俄州(Ohio)。
史蒂芬·伍尔夫预计,从全国范围来看,美国将在今年以后看到这种大流行病的后果。例如,如果大流行病迫使人们推迟筛查或化疗,那么癌症死亡率在未来几年可能会增加。
史蒂芬·伍尔夫说,现在可以通过“为家庭提供帮助,扩大获得医疗保健的机会,改善行为保健服务,并努力为大部分人口带来经济稳定,使哪些在大流行病之前已经生活在贫困线边缘的人群得到救助,从而解决因经济危机而对下游造成的未来疾病和死亡。” 他说,除其他研究外,他的团队在2019年JAMA的工作年龄死亡率研究中(2019 JAMA study of working-age mortality)强调了优先考虑此类公共卫生措施的重要性。
史蒂芬·伍尔夫说:“与其他与美国竞争的国家相比,美国工人的病和死亡要早于其他国家的工人。因此,与COVID-19一样,在健康方面的投资对美国经济也很重要。”
他们的研究还证实了史蒂芬·伍尔夫小组在2020年的早期研究中指出的趋势:激增期间,几种非COVID-19疾病(例如心脏病、阿尔茨海默氏病和糖尿病)的死亡率增加。
VCU医学院院长彼得·巴克利(Peter Buckley)医学博士说:“由于大流行病及其后果,特别是在有色人种的社区,这个国家遭受了巨大的生命损失。” “尽管在这种大流行期间我们必须保持警惕,注意保持社会隔离和戴口罩的行为,但如果我们要减少生命进一步丧失的可能性,我们还必须作出努力,确保医疗的公平分配。”
根据目前的趋势,史蒂芬·伍尔夫说,即使正在进行疫苗接种,美国所看到的激增浪潮也可能不会结束。
“我们还没有脱离险境,因为我们正在与COVID-19变种病毒赛跑。如果我们过早放松,不维持公共卫生限制,疫苗可能不会战胜变种。”史蒂芬·伍尔夫说,“不幸的是,我们看到的是许多州没有吸取2020年的教训。它们又一次取消了限制,企业复工复产,现在却看到COVID-19变种在其人口中扩散。”“为了防止更多的额外死亡,我们需要保持冷静,保持现有的公共卫生限制,这样疫苗才能发挥作用,将病例数量控制住。”上述介绍仅供参考,更多信息敬请注意浏览原文或者相关报道。
The Supplement details the methods. A Poisson regression model used mortality data from 2014-2019 to predict US expected deaths in 2020. Observed deaths in weeks ending March 1, 2020, through January 2, 2021, were taken from provisional, unweighted death counts for the District of Columbia and 49 states, excluding North Carolina for insufficient data. Data sources included the National Center for Health Statistics2-4 and US Census Bureau.5 Data for 8 geographic regions were grouped into distinctive surge patterns. COVID-19 deaths included all deaths for which COVID-19 was cited as an underlying or contributing cause.
Temporal changes in mortality rates from non–COVID-19 causes (eg, Alzheimer disease/dementia, heart disease, diabetes, and 9 other grouped causes; see Supplement) were examined. Data included all deaths in which non–COVID-19 conditions were listed as the underlying cause of death (potentially including deaths for which COVID-19 was a contributing cause). The Joinpoint regression program version 4.8.0.1 (Statistical Research and Applications Branch, National Cancer Institute) was used to specify the weeks (joinpoints) when slopes changed (measured by the annual percentage change [APC]) and their statistical significance (2-sided test, .05 threshold).
Between March 1, 2020, and January 2, 2021, the US experienced 2 801 439 deaths, 22.9% more than expected, representing 522 368 excess deaths (Table). The excess death rate was higher among non-Hispanic Black (208.4 deaths per 100 000) than non-Hispanic White or Hispanic populations (157.0 and 139.8 deaths per 100 000, respectively); these groups accounted for 16.9%, 61.1%, and 16.7% of excess deaths, respectively. The US experienced 4 surge patterns: in New England and the Northeast, excess deaths surged in the spring; in the Southeast and Southwest, in the summer and early winter; in the Plains, Rocky Mountain, and far West, primarily in early winter; and in the Great Lakes, bimodally, in the spring and early winter (Figure). Excess deaths were increasing in all regions at the end of 2020. The 10 states with the highest per capita rate of excess deaths were Mississippi, New Jersey, New York, Arizona, Alabama, Louisiana, South Dakota, New Mexico, North Dakota, and Ohio. New York experienced the largest relative increase in all-cause mortality (38.1%). Deaths attributed to COVID-19 accounted for 72.4% of US excess deaths.
Joinpoint analyses revealed an increase in weekly mortality from non–COVID-19 causes, including heart disease from March 15 to April 11, 2020 (APC, 4.9 [95% CI, 0.7-9.3]), and October 11, 2020, to January 2, 2021 (APC, 1.1 [95% CI, 0.8-1.4]); Alzheimer disease/dementia from March 15 to April 11, 2020 (APC, 7.1 [95% CI, 2.4-12.0]), May 31 to August 15, 2020 (APC, 1.2 [95% CI, 0.7-1.6]), and September 6, 2020, to January 2, 2021 (APC, 1.3 [95% CI, 1.1-1.5]); and diabetes from March 8 to April 11, 2020 (APC, 6.5 [95% CI, 2.8-10.3]), May 31 to July 11, 2020 (APC, 2.6 [95% CI, 0.2-5.0]), and October 18, 2020, to January 2, 2021 (APC, 2.2 [95% CI, 1.6-2.8]).
The 22.9% increase in all-cause mortality reported here far exceeds annual increases observed in recent years (≤2.5%). The percentage of excess deaths among non-Hispanic Black individuals (16.9%) exceeded their share of the US population (12.5%),5 reflecting racial disparities in COVID-19 mortality. Excess deaths surged in the east in April, followed by extended summer and early winter surges concentrated in southern and western states, respectively. Many of these states weakly embraced, or discouraged, pandemic control measures and lifted restrictions earlier than other states.1,6
Excess deaths not attributed to COVID-19 could reflect either immediate or delayed mortality from undocumented COVID-19 infection, or non–COVID-19 deaths secondary to the pandemic, such as from delayed care or behavioral health crises. Death rates from several non–COVID-19 diseases (eg, heart disease, Alzheimer disease) increased during surges. The model does not adjust directly for population aging, which could contribute to an overestimate of excess deaths. Other study limitations include reliance on provisional data, inaccurate death certificates, and modeling assumptions.
https://blog.sciencenet.cn/blog-212210-1280452.html
上一篇:ProteinGAN:生成功能性蛋白质序列的对抗性网络
下一篇:新电池震撼了可再生能源储能