博文
selenocysteine fluorescent probe for thyroid diseases
|
Detection of Selenocysteine with a Ratiometric near-Infrared Fluorescent Probe in Cells and in Mice Thyroid Diseases Model
Xianzhu Luo【罗贤柱】 Rui Wang【王锐】 Chuanzhu Lv,Guang Chen【陈光】* Jinmao You【尤进茂】* Fabiao Yu【于法标】*
Abstract

The pathological progression of thyroid diseases poses a serious threat to human health. Because thyroid diseases are closely related to selenocysteine (Sec), it is necessary to investigate the relationship between Sec and thyroid diseases. Herein, we design and synthesize a ratiometric near-infrared fluorescent probe (Mito-Cy-Sec) to analyze the fluctuations and roles of Sec in cells and in mice thyroid diseases model. The probe is composed of a near-infrared heptamethine cyanine fluorophore, an acrylamide as the response moiety, and a lipophilic triphenylphosphonium cation as the mitochondrial localization group. After reacting with Sec for 5 min, the probe Mito-Cy-Sec exhibits a distinct ratiometric fluorescence signal accompanied by a color change from green to blue. The applicability of Mito-Cy-Sec in mitochondrial localization is assessed via the super-resolution imaging. Mito-Cy-Sec has been successfully applied to detect the fluctuations of Sec concentration in human thyroid epithelial/cancer cell lines (Nthy-ori-3 cells/BHT101 cells) and mice thyroid disease (thyroiditis and thyroid cancer) models. Besides, both of our probes Mito-Cy-Sec and commercial ROSGreen H2O2 are employed to examine the interrelationship between H2O2 and Sec in cells and in mice models. The results demonstrate that the relevant-levels between H2O2 and Sec are exactly negative correlation. The related-levels of Sec and H2O2 may be identified as diagnostic indicators for the auxiliary diagnosis of thyroid diseases. We suppose that our probe Mito-Cy-Sec can be employed as a promising chemical tool for the diagnosis of thyroid diseases.
Publication Date:December 9, 2019
https://doi.org/10.1021/acs.analchem.9b04860
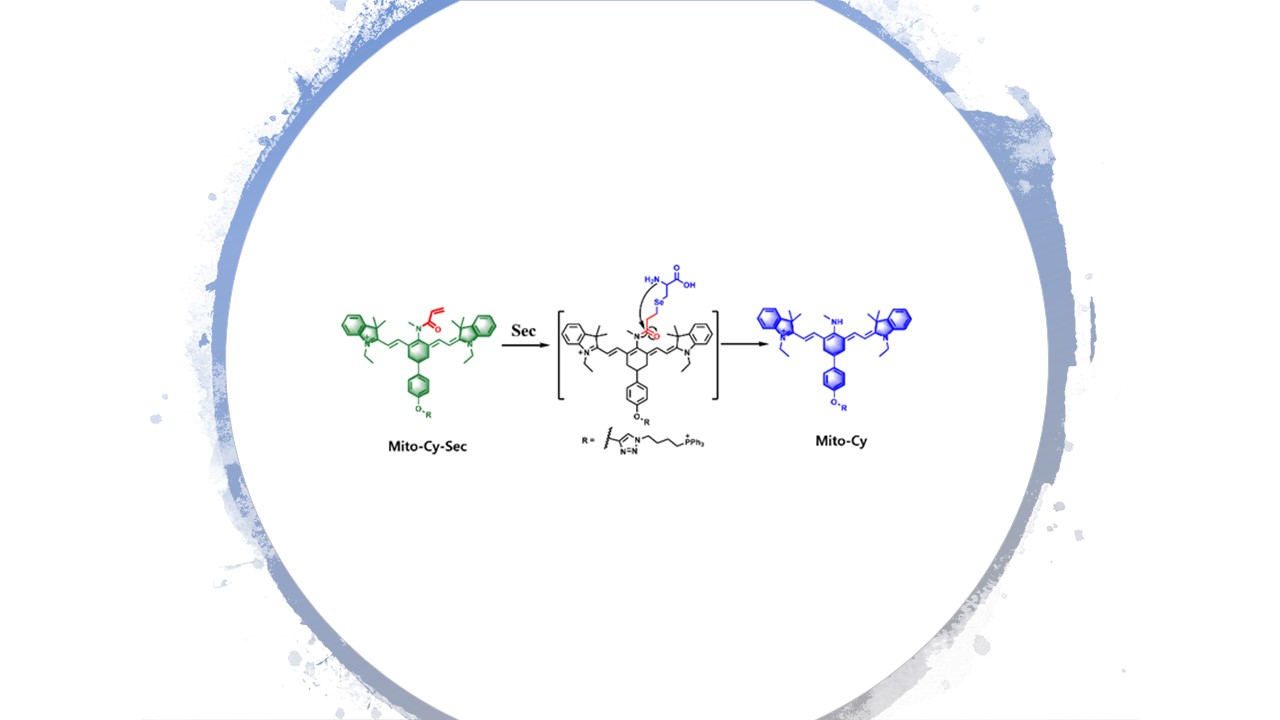
Scheme 1. The molecular structure of Mito-Cy-Sec and its proposed response mechanism towards selenocysteine

Figure 1. Spectral properties and selectivity of Mito-Cy-Sec. Data were recorded after 5 min incubated with different concentration of Sec (0 - 15 μM) at 37 oC in HEPES (pH 7.4, 10 mM). Dose-dependent absorbance spectra a), emission spectra b) (λex = 630 nm, λem = 720 - 780 nm) and c) (λex = 730 nm, λem = 780 - 840 nm). d) The linear relationship between lg (F765 nm/F825 nm) and Sec. Insert: Ratiometric intensity changes with different concentrations of Sec. e) Time-dependent fluorescent ratio (F765 nm/F825 nm) toward Sec during 0 - 390 s, and probe was added at 30 s. f) The fluorescent ratio (F765 nm/F825 nm) response of Mito-Cy-Sec to various reactive species at 5 min: 1, blank, 2, 150 μM GSH; 3, 150 μM Cys; 4, 150 μM Hcy; 5, 15 μM NaHS; 6, 15 μM NAC; 7, 15 μM selenomethionine; 8, 15 μM selenocystine; 9, 15 μM Se-methylselenocysteine; 10, 15 μM ascorbic acid; 11, 15 μM GPx; 12, 15 μM TrxR; 13, 15 μM Na2SeO3; 14, 15 μM DTT; 15, 15 μM Sec. The experiments were repeated three times and the data were shown as mean (± S.D.).
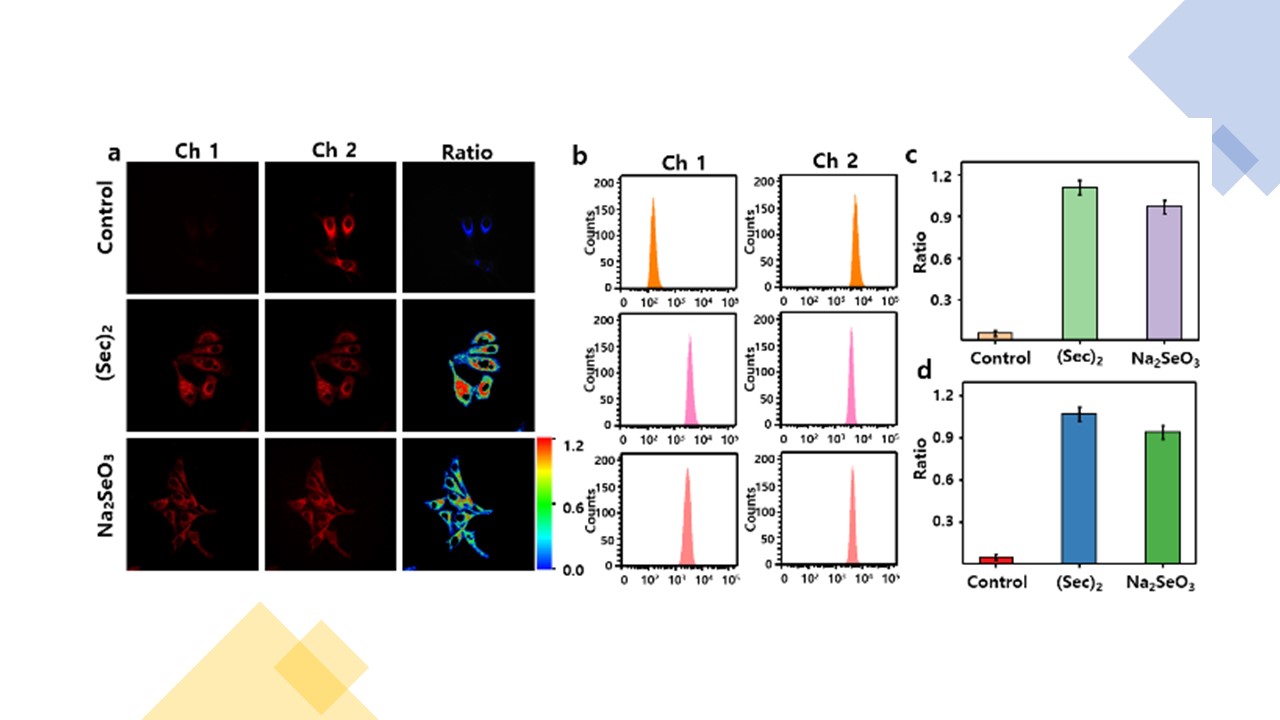
Figure 2. Fluorescence images and flow cytometry analyses of endogenous and exogenous Sec in Hela cells. a) Incubated with Mito-Cy-Sec (10 μM) for 10 min as control. Another two cell groups were pretreated with (Sec)2 (2 μM) and Na2SeO3 (5 μM) for 12 h, then incubated with 10 μM probe for 10 min, respectively. Fluorescence collection windows for Ch 1: 720 - 780 nm (λex = 630 nm), Ch 2: 780 - 840 nm (λex = 730 nm). b) Corresponding flow cytometry analysis. c) The average ratiometric values in a. d) Mean ratiometric values in b. The experiments were repeated three times and the data were shown as mean (± S.D.).
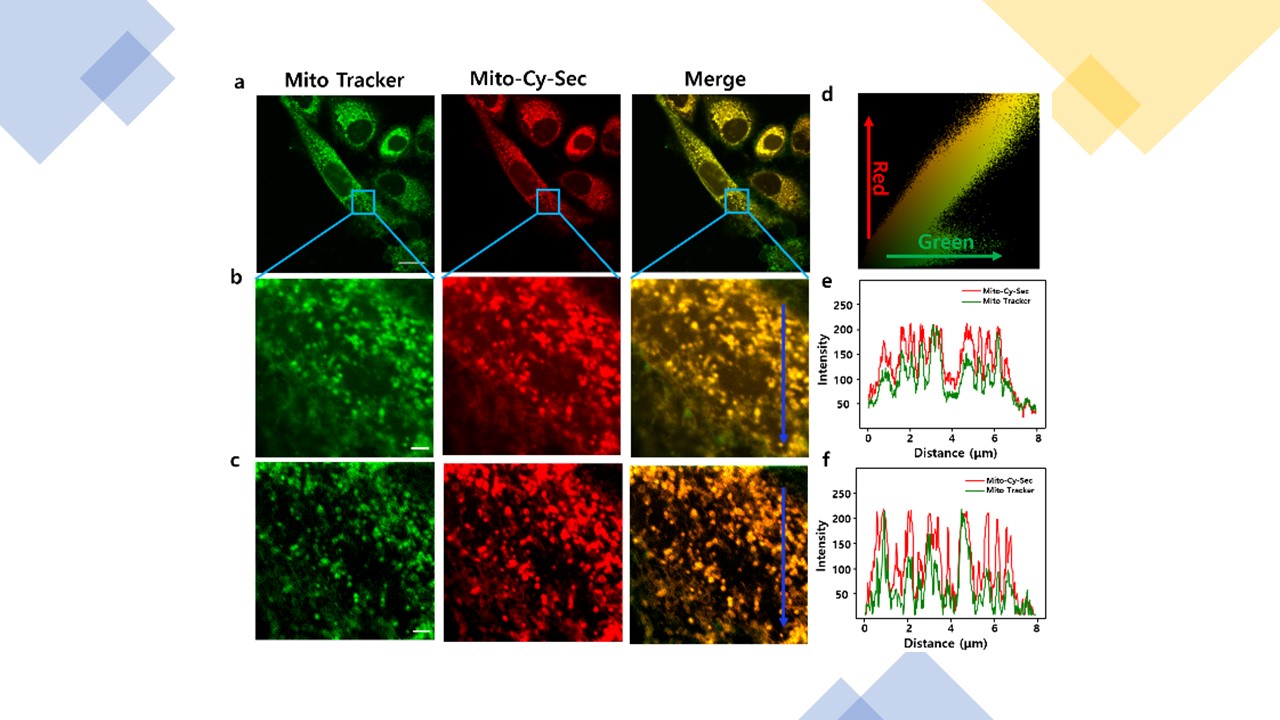
Figure 3. Mitochondrial colocalization with Mito-Cy-Sec and Mito Tracker Green FM in HepG2 cells. Fluorescence collection windows for green channel: 500 - 550 nm (λex = 488 nm), and red channel: 780 - 840 nm (λex = 730 nm). a) Cells were stained with MitoTracker Green FM (200 nM) for 30 min and Mito-Cy-Sec (10 μM) for 10 min, scale bar: 10 μm. b) Enlarged images in the field view of the cyan frame in a) for mitochondrial colocalization. c) Super-resolution imaging of mitochondria with the same region in b), scale bar: 2 μm. d) The colocalization and correlation between the selected red and green channels in a). e) and f) Intensity profile of the blue arrow in b) and c) across cell, respectively.
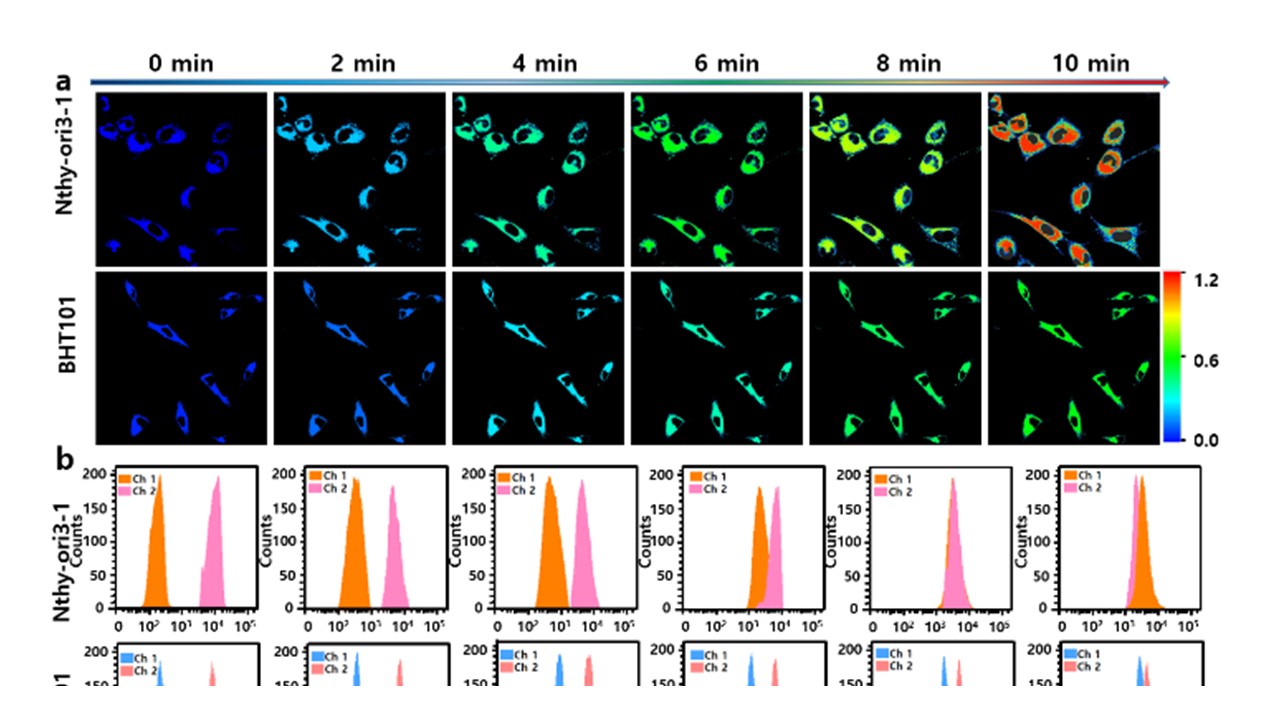
Figure 4. Imaging of endogenous Sec in Nthy-ori3-1 and BHT101 cells. a) Pseudo-color ratiometric images of endogenous Sec generation in Nthy-ori3-1 cells and BHT101 cells at different time points: 0 min, 2 min, 4 min, 6 min, 8 min, and 10 min. b) Flow cytometry analysis for a). c) and d) Average ratiometric intensities changes of Mito-Cy-Sec toward Nthy-ori3-1 and BHT101 cells in a) and b), respectively. The experiments were repeated three times and the data were shown as mean (± S.D.).
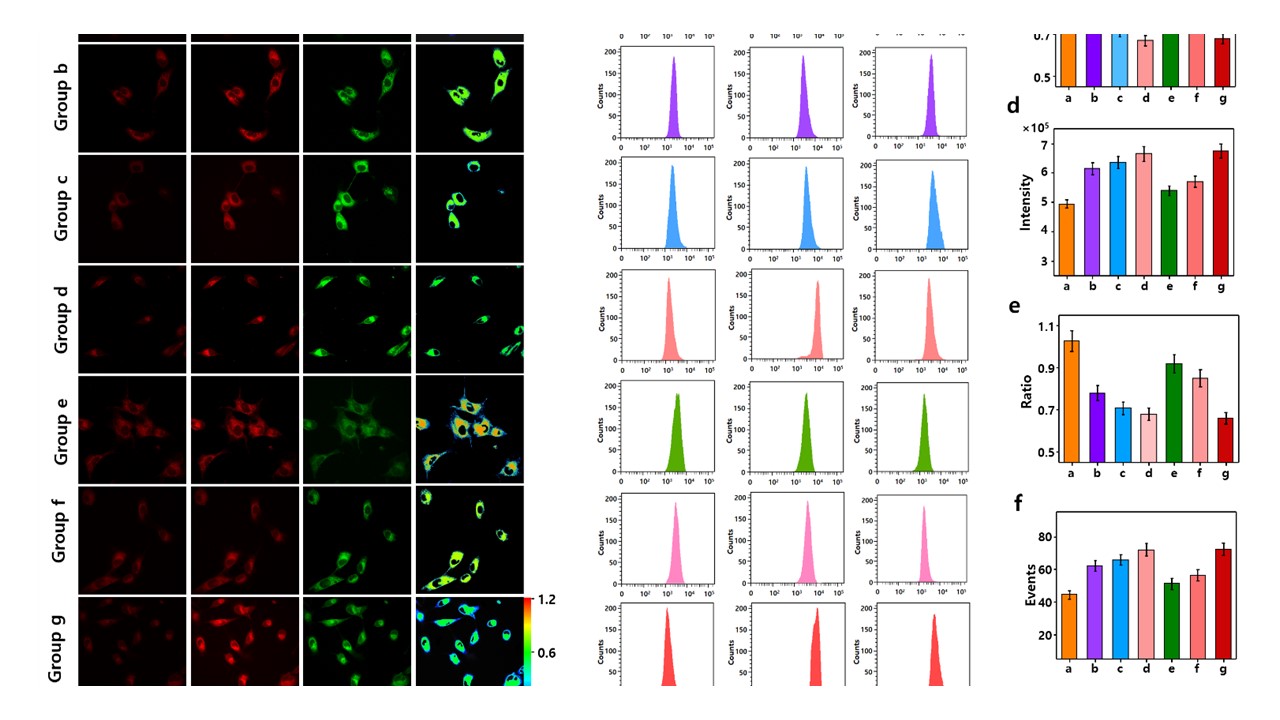
Figure 5. Ratiometric fluorescence images of Sec in different types of thyroid disease cell models with Mito-Cy-Sec (10 μM) and ROSGreen H2O2 (5 μM) by confocal microscopic imaging and flow cytometry analysis. a) The ratiometric images of endogenous Sec in thyroid model cells. Group a: Nthy-ori3-1 cells; Group b: Nthy-ori3-1 cells stimulated by INF-γ for 24 h; Group c: Nthy-ori3-1 cells stimulated by INF-γ/LPS for 6 h; Group d: BHT101 cells; Group e: Nthy-ori3-1 cells incubated with 50 μM selenocysteine (Sec)2 for 2 h before stimulated by INF-γ; Group f: Nthy-ori3-1 cells incubated with 50 μM (Sec)2 for 2 h before stimulated by INF-γ/LPS; and Group g: BHT101 cells incubated with 50 μM (Sec)2 for 2 h. Fluorescence collection windows for Ch 1: 720 - 780 nm (λex = 630 nm), Ch 2: 780 - 840 nm (λex = 730 nm), and Ch 3: 500 - 550 nm (λex = 488 nm). b) Flow cytometry analysis of the cells in a). c) The average ratio (Ch 1 : Ch 2) values in a). d) Mean fluorescent intensities of Ch 3 in a). e) The average ratio (Ch 1 : Ch 2) values in b). f) Mean fluorescent intensities of Ch 3 in b). g) Apoptosis and necrosis assays of group a - g in a) by Annexin V-FITC/Propidium Iodide (PI). Q1): necrosis, Q2): late apoptosis, Q3): early apoptosis, Q4): viable. Scale bar: 20 μm. The experiments were repeated three times and the data were shown as mean (± S.D.).
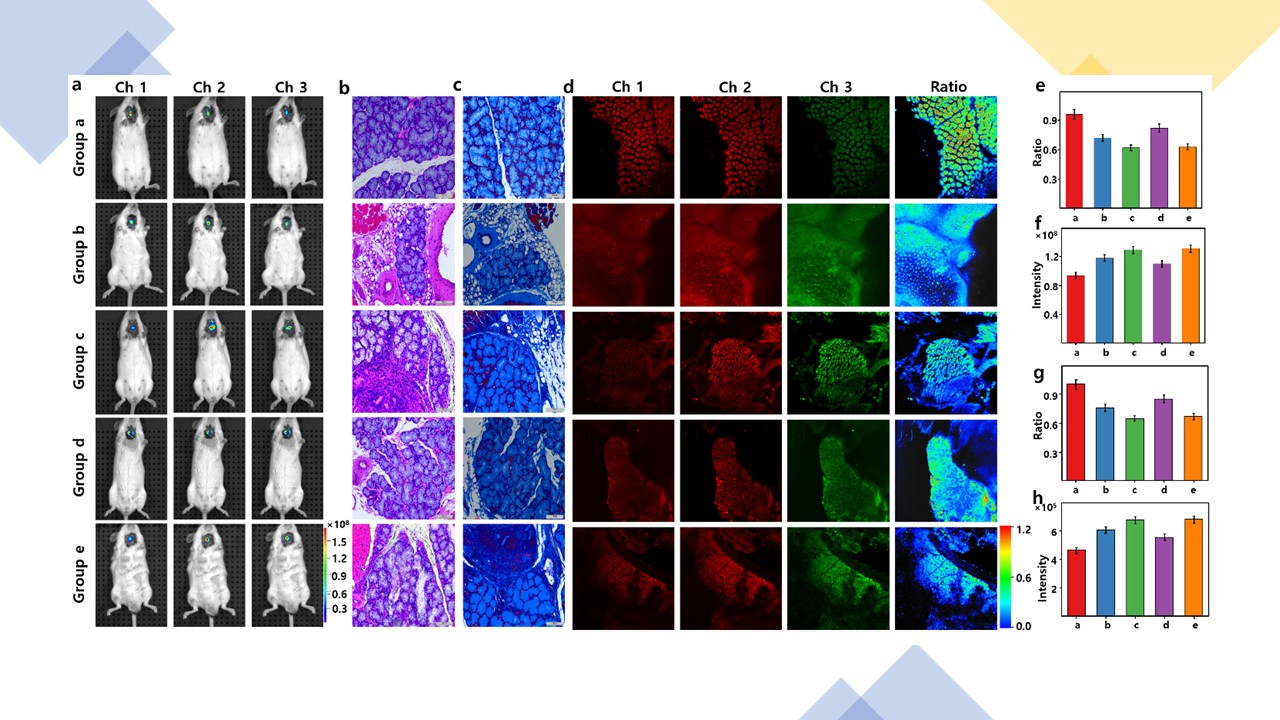
Figure 6. In vivo imaging of Sec in different mice thyroid diseases model. a) Fluorescence images of mice in group a - group e. group a: control group; group b: thyroiditis mice group; group c: thyroid cancer mice; group d: BALB/c mice were pretreated with 500 μg.kg-1 selenocystine (intraperitoneal injection, (i.p.)) in saline daily for eight weeks before the same treatment of group b; and group e: BALB/c mice were pretreated with 500 μg.kg-1 selenocystine (i.p.) in saline daily for eight weeks before the same treatment as group c. All the mice models were treated with Mito-Cy-Sec (10 μM, 50 μL in DMSO : saline = 1 : 99, v:v) and ROSGreen H2O2 (5 μM, 50 μL in DMSO : saline = 1 : 99, v:v) for 30 min through neck injection before in vivo fluorescence imaging. Fluorescence collection windows for Ch 1: 720 - 780 nm (λex = 630 nm), Ch 2: 780 - 840 nm (λex = 730 nm), Ch 3: 500 - 550 nm (λex = 488 nm), and ratio: Ch 1 vs Ch 2. b) H&E stained thyroid tissues histopathology images. c) Masson's stained slices of thyroid tissues. d) Fluorescence images of different fresh mice thyroid diseases slices by simultaneously incubated with Mito-Cy-Sec (10 μM) and ROSGreen H2O2 (5 μM) for 20 min. e) The average ratio (Ch 1 vs Ch 2) values in a). f) Mean fluorescent intensities of Ch 3 in a). g) The average ratio (Ch 1 vs Ch 2) values in d). h) Mean fluorescent intensities of Ch 3 in d).
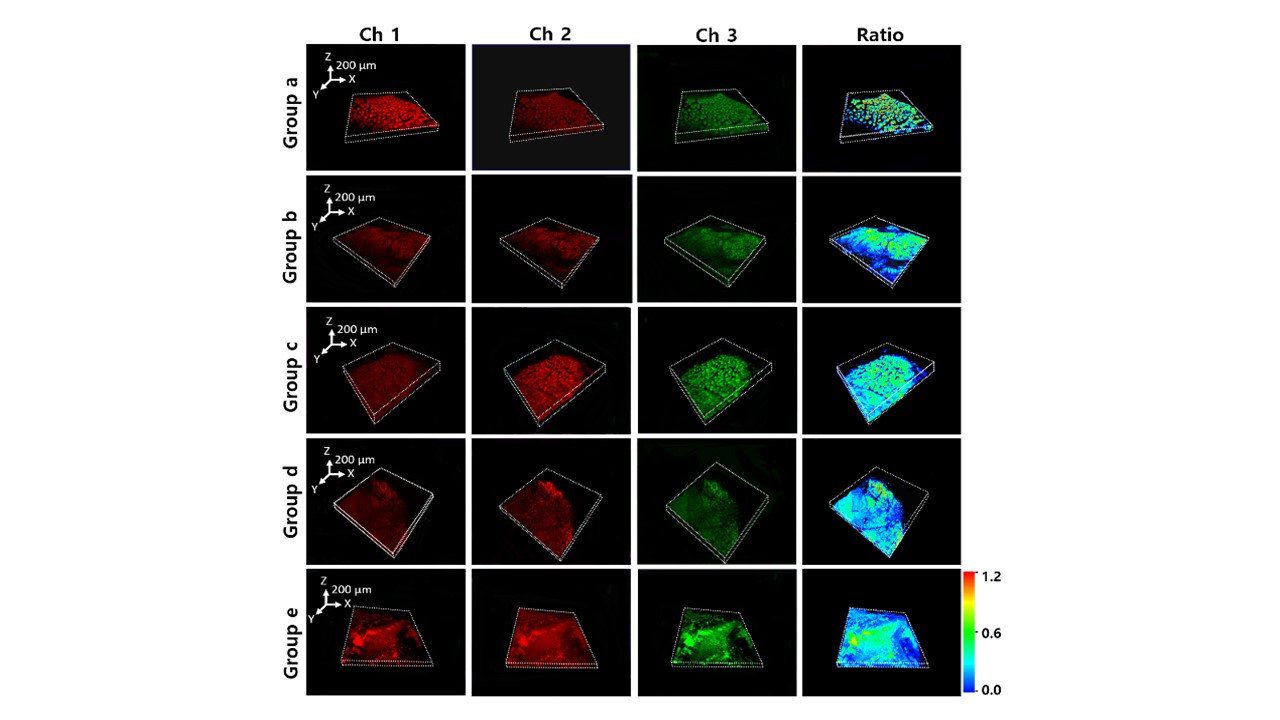
Figure 7. Fluorescence 3D images of different mice thyroid diseases slices incubated with Mito-Cy-Sec (10 μM) and ROSGreen H2O2 (5 μM) for 20 min. Fluorescence collection windows for Ch 1: 720 - 780 nm (λex = 630 nm), Ch 2: 780 - 840 nm (λex = 730 nm), Ch 3: 500 - 550 nm (λex = 488 nm), and Ratio images: Ch 1 : Ch 2.
https://blog.sciencenet.cn/blog-2438823-1212426.html
上一篇:Self-assembled nanomaterials for phototherapy of cancer
下一篇:Imaging mutual regulation between zinc cation and nitrosyl
全部作者的其他最新博文
- • Triphenylamine-AIE Materials for Cancer Theranostics
- • Fluorescent Probe forRatiometric Monitoring of Peroxynitrite
- • Fluorescence Probe for Pathological Stages of Wound Healing
- • Macrophage M2 polarization to neurological damage
- • SERS-RCA biosensor for profiling dual miRNAs
- • a glutathione-activated near-infrared fluorescent probe