博文
Imaging mutual regulation between zinc cation and nitrosyl
|
Imaging of the mutual regulation between zinc cation and nitrosyl via two-photon fluorescent probes in cells and in vivo
MingshunLi【李明顺】 YanlongXing【邢艳珑】 YuxiaZou【邹玉霞】 GuangChen【陈光】 JinmaoYou【尤进茂】 FabiaoYu【于法标】
a The Key Laboratory of Life-Organic Analysis, Key Laboratory of Pharmaceutical Intermediates and Analysis of Natural Medicine, College of Chemistry and Chemical Engineering, Qufu Normal University, Qufu 273165, China
b Institute of Functional Materials and Molecular Imaging, Key Laboratory of Emergency and Trauma, Ministry of Education, Key Laboratory of Hainan Trauma and Disaster Rescue, College of Clinical Medicine, College of Emergency and Trauma, Hainan Medical University, Haikou 571199, China
https://doi.org/10.1016/j.snb.2020.127772
Sensors & Actuators: B. Chemical 309 (2020) 127772
Highlights
•We designed and synthesized two-photon fluorescent probes CHP-H and CHP-CH3 for Zn2+ detection.
•The two probes exhibited high sensitivity, selectivity, and low limit of detection towards Zn2+ (19 and 25 nM).
•CHP-H was chosen to track the changes of intracellular Zn2+ in cells and in ischemia/reperfusion mice models.
•The two probes featured deep tissue penetration and real-time imaging of Zn2+ in mice hippocampus specimens.
•We verified the mutual regulatory interaction between Zn2+ and HNO in cells and in mice models.
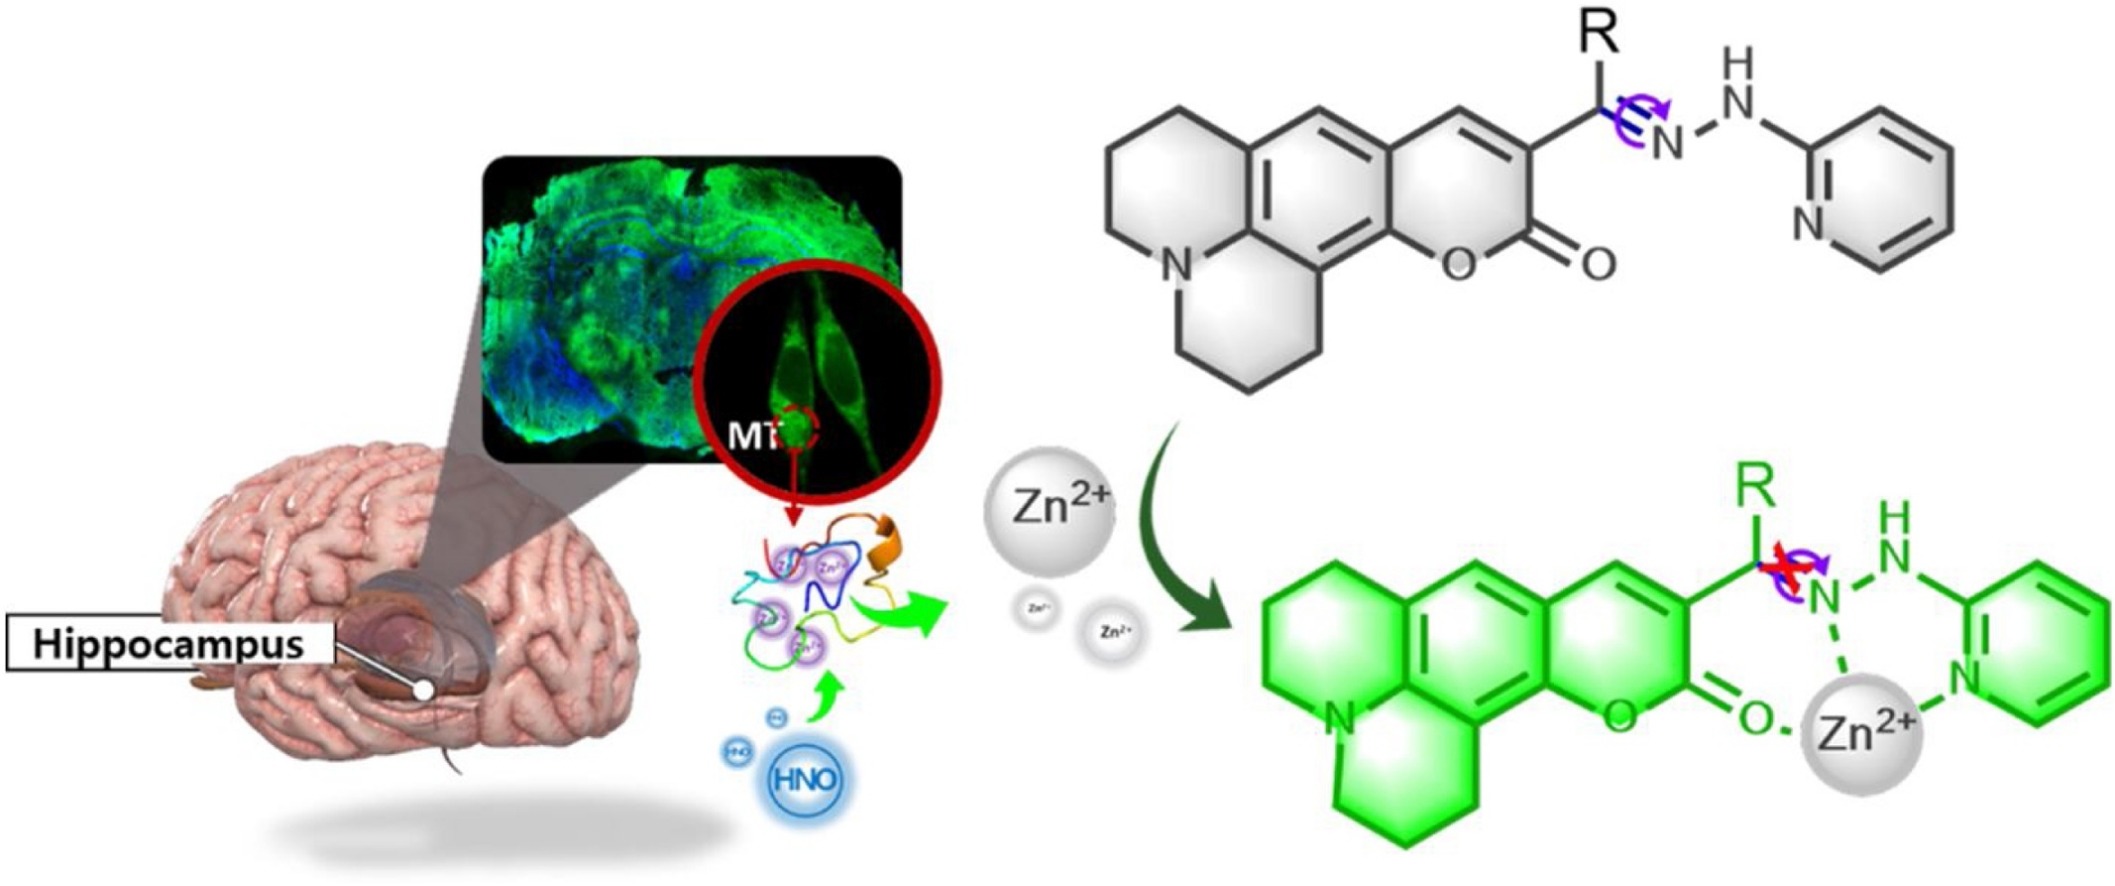
The homeostatic disorder of intracellular Zn2+ pool is closely associated with severe diseases. It has been reported that the high level of free Zn2+ during ischemia/reperfusion (I/R) process can result in oxidative stress damage on nerve cells. Given that nitrosyl (HNO) can aggravate the nerve injury during cerebral I/R process, we assume that there may exist a mutual regulation between Zn2+ and HNO under certain physiological conditions. To reveal this potential small-signaling-molecule crosstalk, we synthesized two-photon fluorescent probes CHP-H and CHP-CH3 to monitor intracellular Zn2+ in cell and mice hippocampus I/R models. The probes consist of two moieties: coumarin derivative as the two-photon fluorescence transducer, 2-hydrazino pyridine as the fluorescence modulator and Zn2+ chelator. Both probes exhibit excellent analytical properties for Zn2+ detection in simulated physiological systems. Utilizing CHP-H and an HNO probe Cyto-JN, we perform fluorescent imaging of cell I/R models. The results confirm that HNO can stimulate Zn2+ release from labile Zn2+ pool, whereas, the increase of intracellular Zn2+ cannot upregulate the level of HNO. Combining with the deep tissue imaging of mice hippocampus tissues, our probes may provide potential approaches for the medical diagnostic assessment of HNO regulation effect on Zn2+ release in clinical cerebral I/R-related diseases.
Keywords
Fluorescent probes
Two-photon
Zinc cation
Nitrosyl
Cell imaging
In vivo imaging
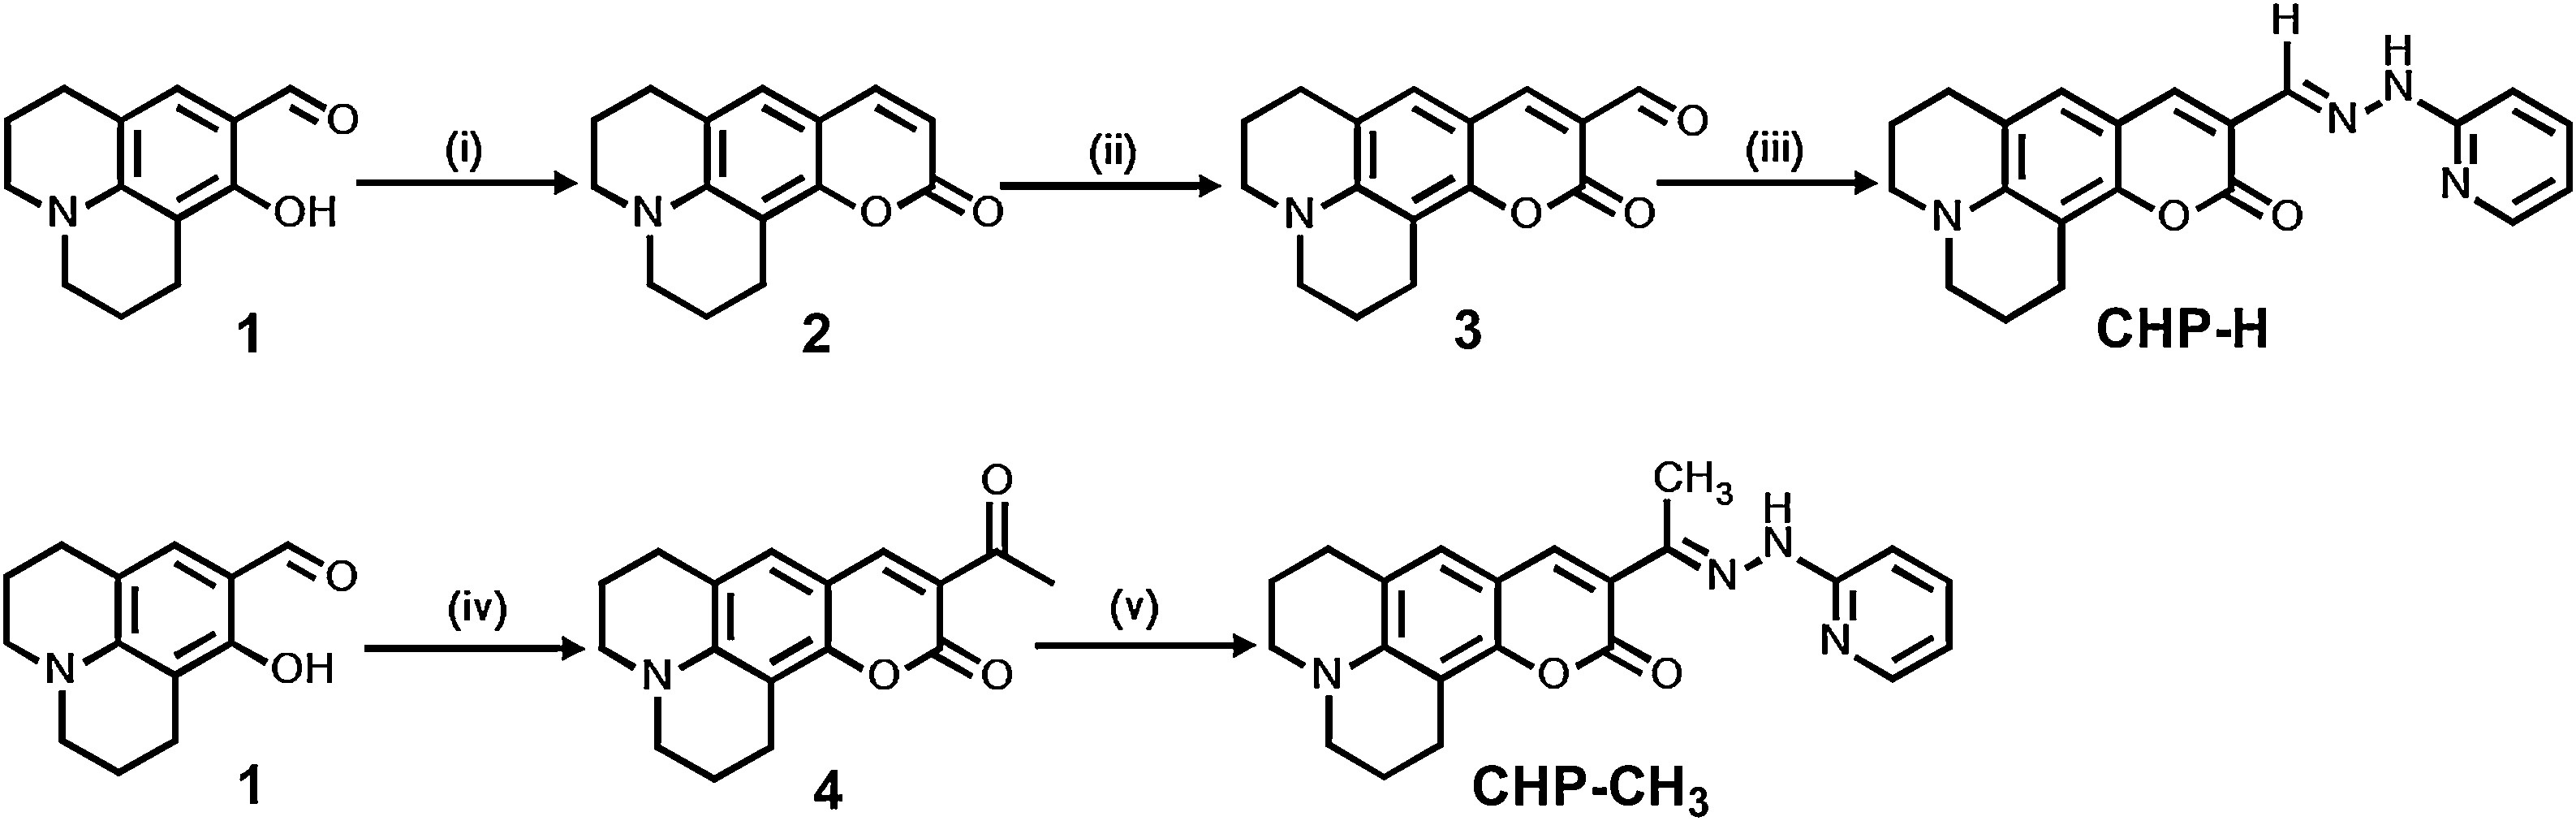
Scheme 1. The procedures for the syntheses of probes CHP-H and CHP-CH3. (i) 8-hydroxyjulolidine-9-carboxaldehyde, diethyl malonate, piperidine and ethanol; reflux. HCl (con.), acetic acid; heat and stir. (ii) DMF, POCl3; stir. (iii) 2-hydrazinopyridine, ethanol; reflux. (iv) ethyl acetoacetate, piperidine, ethanol; reflux. (v) 2-hydrazinopyridine, ethanol; reflux.
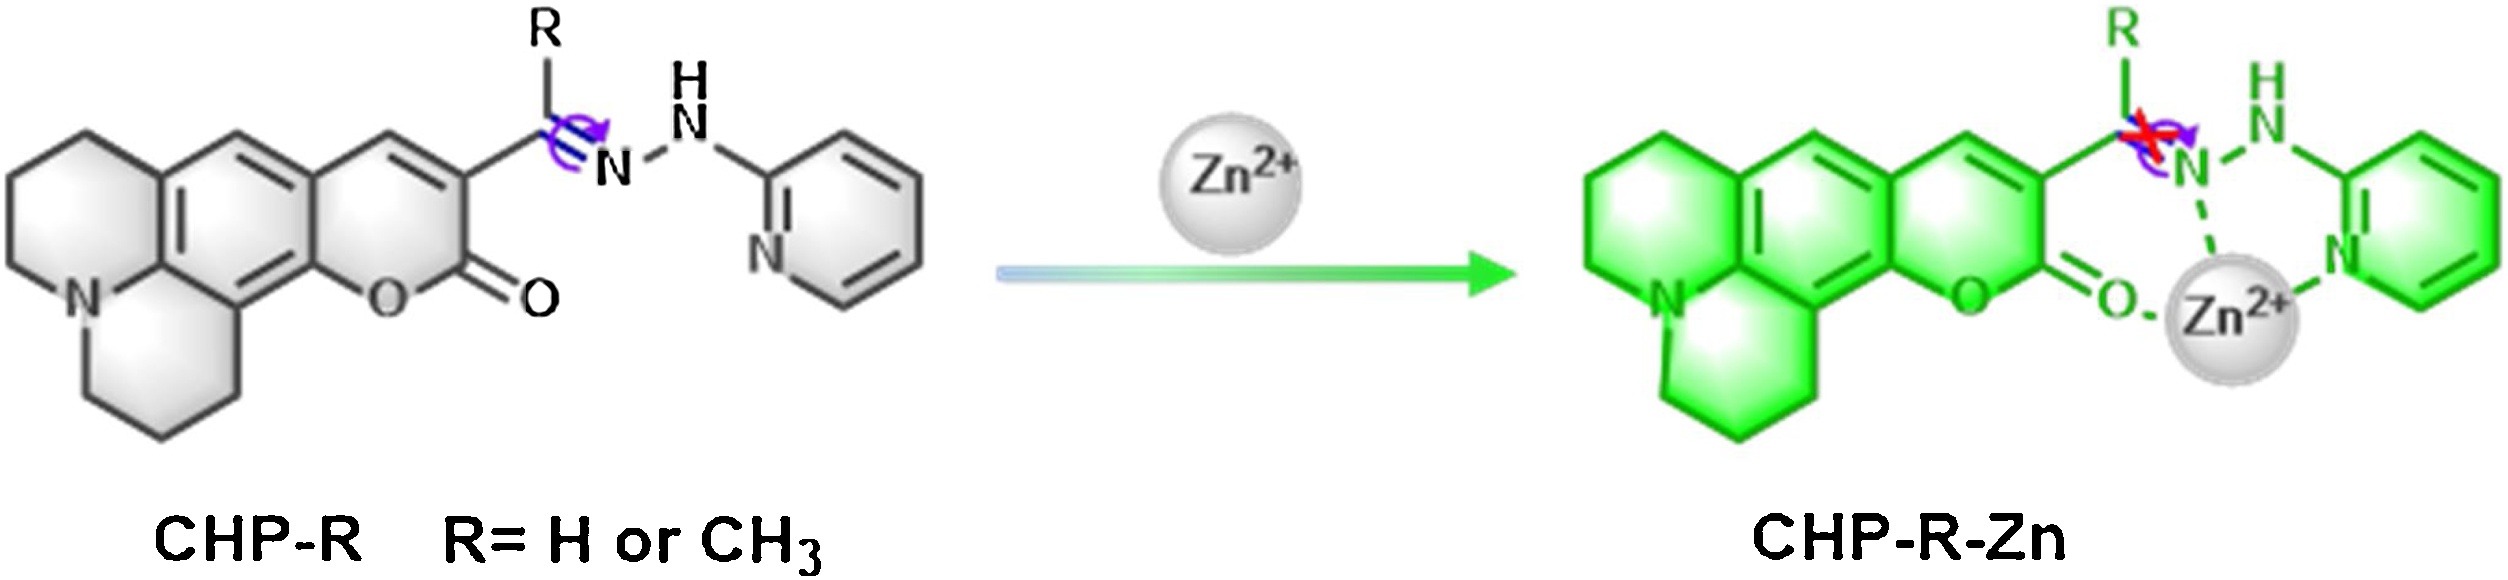
Scheme 2. The molecule structure of probes and proposed detection mechanism against Zn2+.
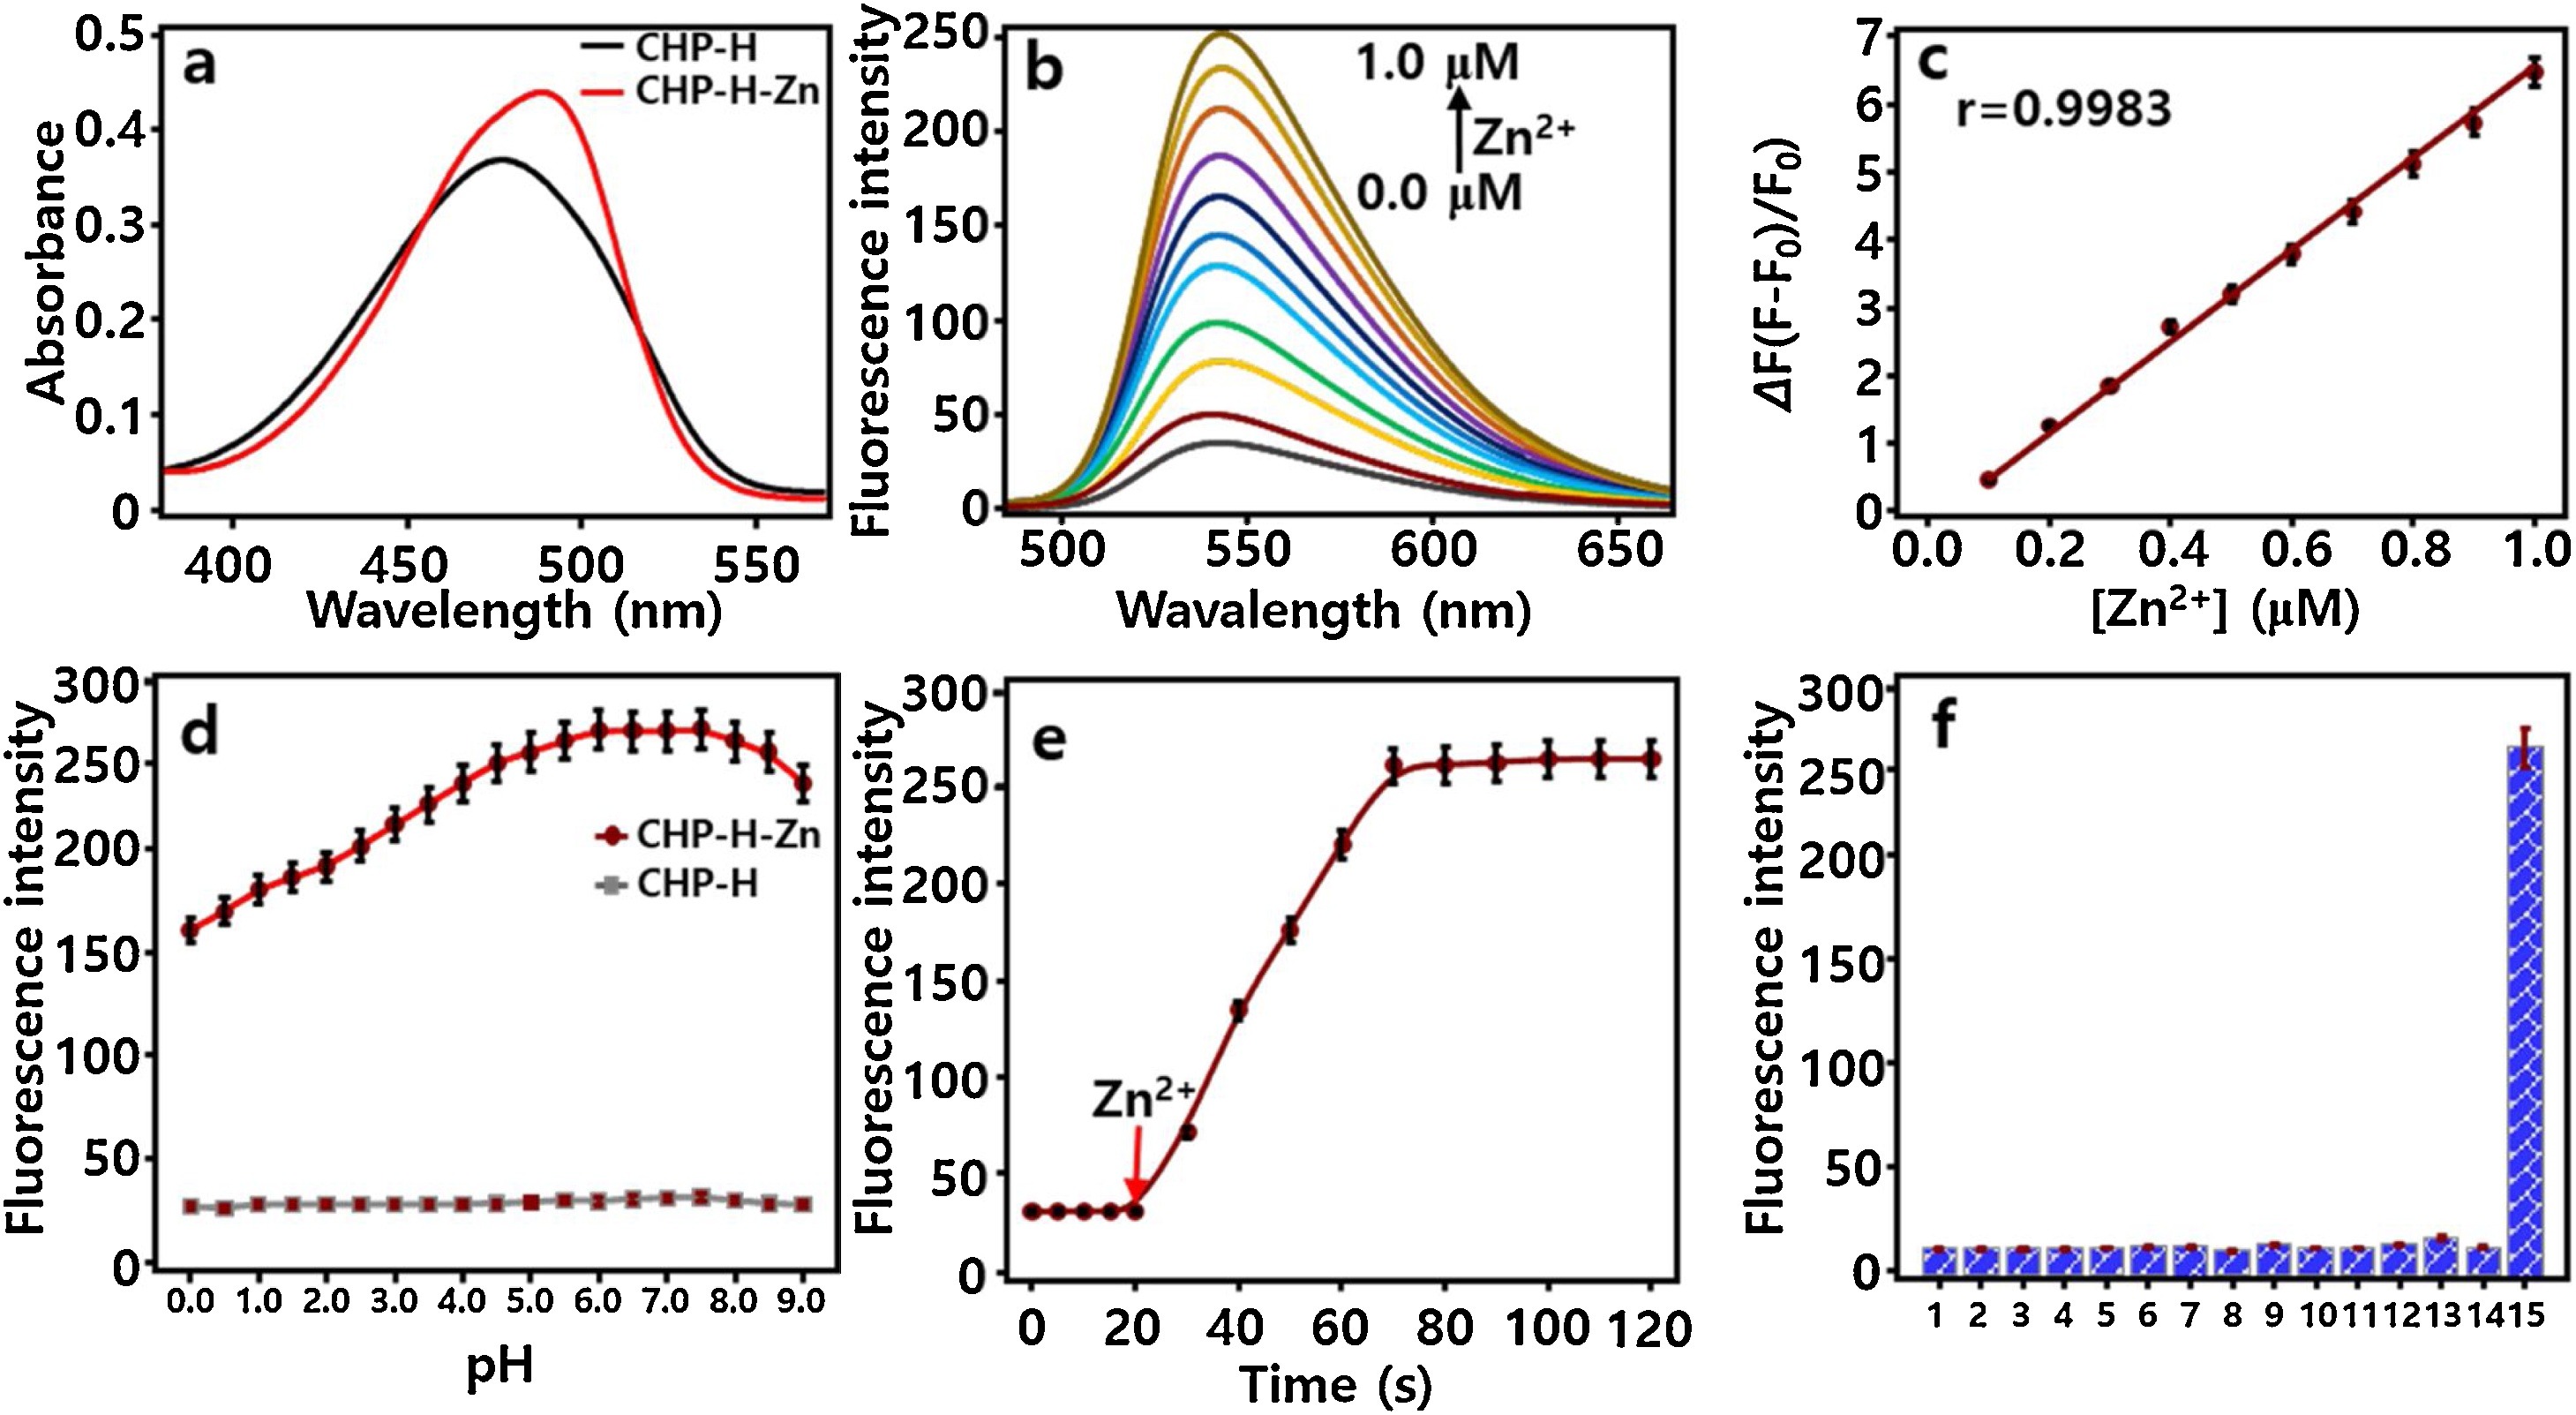
Fig. 1. Spectroscopic properties and selectivity of probe CHP-H. CHP-H (1.0 μM) mixed with various concentrations of Zn2+ (0.0–1.0 μM) at 37 °C in HEPES (pH 7.4, 10 mM) for 3 min (λex/λem = 465/543 nm). a) Absorbance of CHP-H (1.0 μM) in absent (black) and present (red) of Zn2+ (1.0 μM). b) Fluorescence titration of CHP-H (1.0 μM) with increasing concentrations of Zn2+: 0.0, 0.1, 0.2, 0.3, 0.4, 0.5, 0.6, 0.7, 0.8, 0.9, and 1.0 μM. c) The linear relationship between the fluorescent intensity ratio ΔF = (F-F0)/F0 and Zn2+ levels. d) The fluorescence emission changes of CHP-H at 543 nm toward the pH range of 0.0–9.0 in the absent and present of Zn2+ (1.0 μM). e) Fluorescence intensities of CHP-H (1.0 μM) against the reaction time in the presence of Zn2+ (1.0 μM). f) Selectivity of CHP-H (1.0 μM) in the presence of various metal ions: 1. Na+ (10 mM), 2. K+ (140 mM), 3. Mg2+ (0.5 mM), 4. Ca2+ (100 μM), 5. Co2+ (10 μM), 6. Cu2+ (10 μM), 7. Ni2+ (10 μM), 8. Mn2+ (10 μM), 9. Fe2+ (10 μM), 10. Pb2+ (10 μM), 11. Hg2+ (10 μM), 12. Ba2+ (10 μM), 13. Cd2+ (10 μM), 14. Al3+ (10 μM), 15. Zn2+ (1.0 μM). The experiments were repeated three times and the data were shown as mean (± s.d.). (For interpretation of the references to colour in this figure legend, the reader is referred to the web version of this article.)
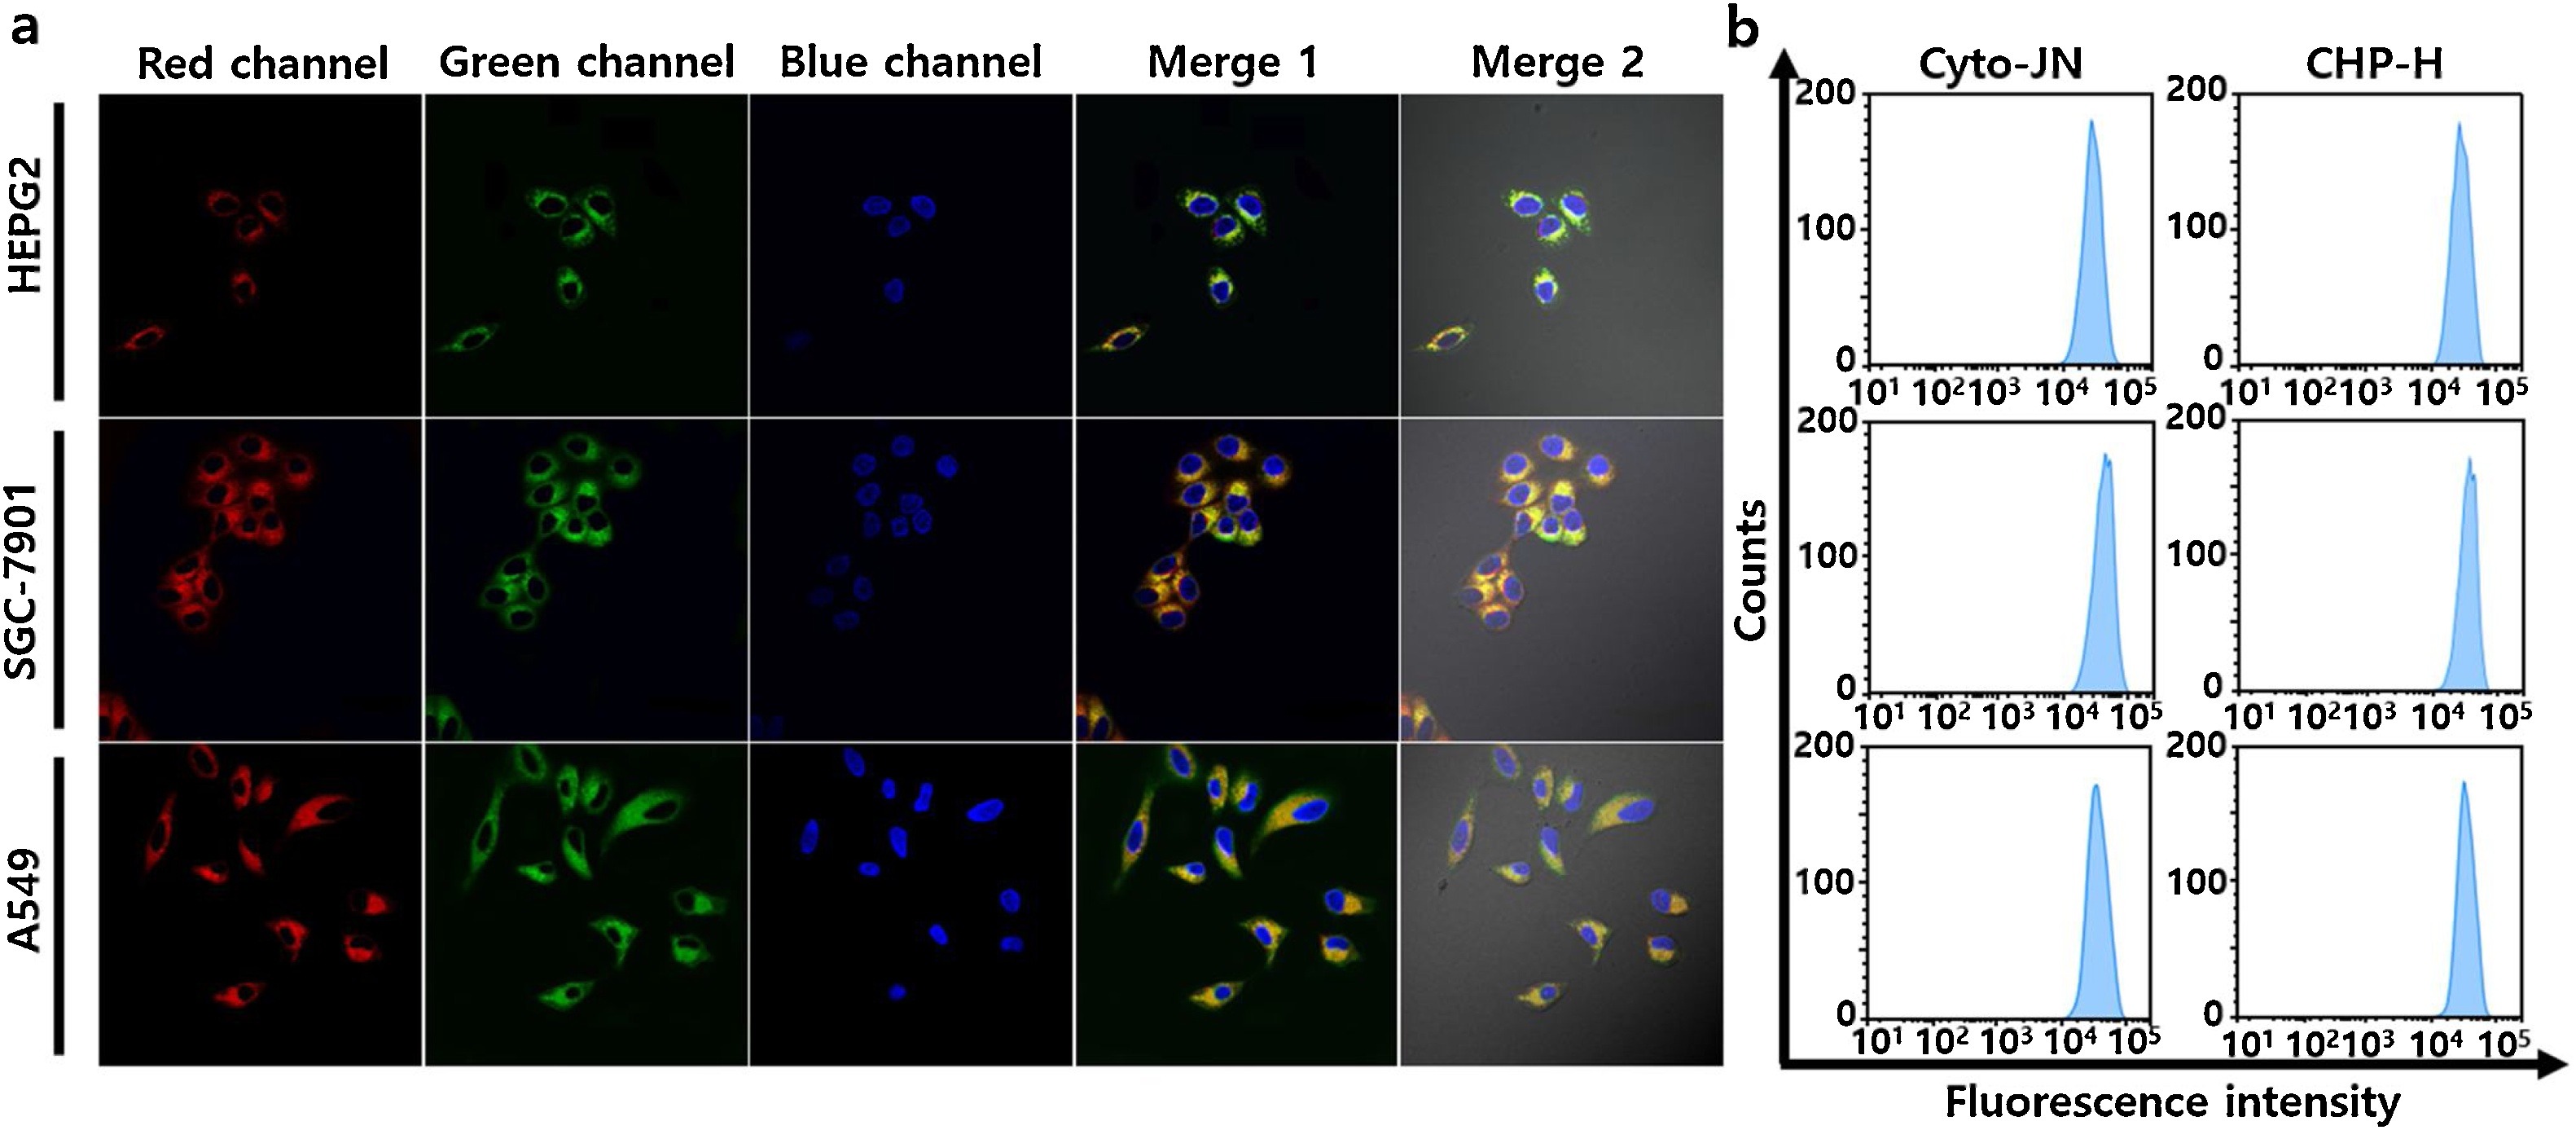
Fig. 2. Imaging capability of the probe CHP-H for Zn2+ detection in living hepatoblastoma cell lines (HepG2 cells), human gastric cancer cell lines (SGC-7901 cells) and non-small cell lung cancer cell lines (A549 cells). a) Three types of cell lines were pretreated with 1 mM Angeli's Salt (an HNO donor) and 25 μM zinc gluconate for 30 min, respectively, and subsequently incubated with 1 μM CHP-H for 5 min, 5 μM Cyto-JN (HNO probe) for 15 min, and 100 ng/mL DAPI with for 30 min. Scale bars: 20 μm. b) Flow cytometry analyses of red and green channel in a). Fluorescence collection windows: λex =880 nm, λem = 520–560 nm (CHP-H green channel); λex =680 nm, λem = 690–720 nm (Cyto-JN Red channel); λex =405 nm, λem = 420−480 nm (DAPI blue channel). (For interpretation of the references to colour in this figure legend, the reader is referred to the web version of this article.)
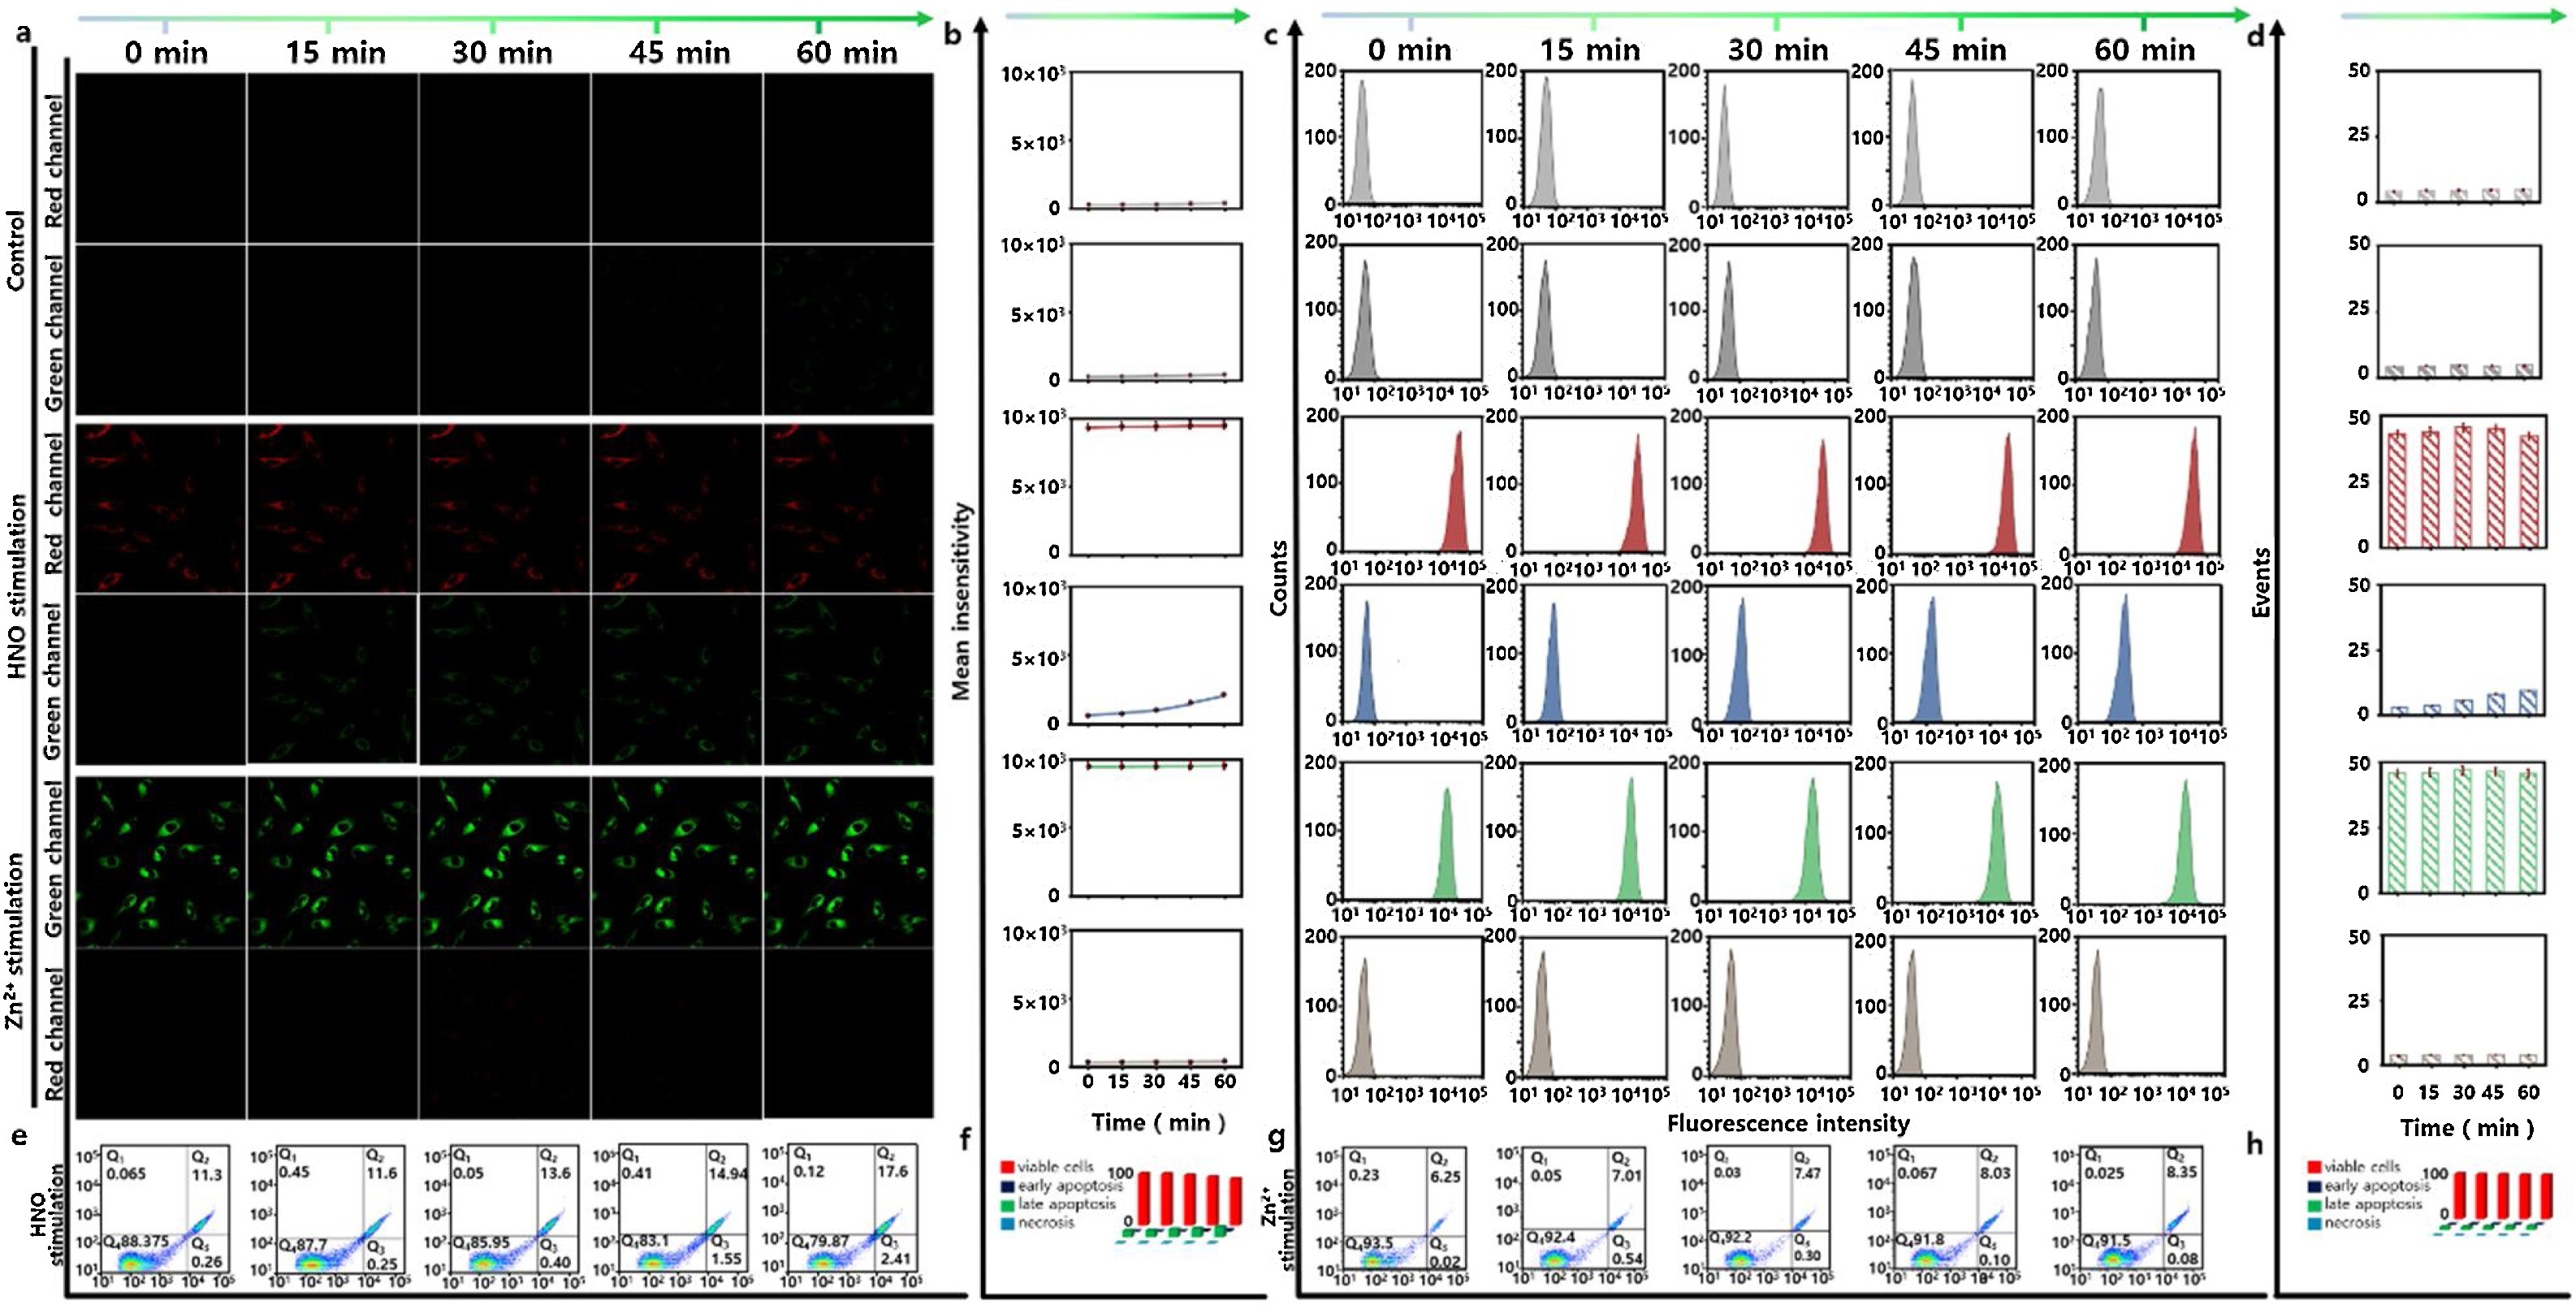
Fig. 3. Confocal microscopy images and flow cytometry assay for evaluating the mutual regulations between Zn2+ and HNO in HT22 cells. a) All cells were treated with CHP-H (1 μM) for 5 min and Cyto-JN (5 μM) for 15 min, then the cells were washed, and the images were acquired at different time points: 0, 15, 30, 45, 60 min. The HNO-stimulation group: the HT22 cells were incubated with Angeli's Salt (1 mM) for 3 h. The Zn2+-stimulation group: the HT22 cells were incubated with Zn2+ (25 μM) for 3 h. Fluorescence collection windows: λex = 880 nm, λem = 520–560 nm (CHP-H green channel). λex = 680 nm, λem = 690–720 nm (Cyto-JN red channel). Scale bars: 20 μm. b) The corresponding mean intensity changes of fluorescence images in a). c) Flow cytometry analyses for a). d) Mean values of c). e) Apoptosis analysis detected by Annexin V-FITC assay for HNO-stimulation group. f) The apoptosis ratio in e). g) Apoptosis analysis by Annexin V-FITC for Zn2+-stimulation group. h) The percentage of apoptosis in g). Q1: necrosis cells, Q2: late apoptotic cells, Q3: early apoptotic cells, Q4: survival cells. The data were shown as mean (± s.d.). (For interpretation of the references to colour in this figure legend, the reader is referred to the web version of this article.)
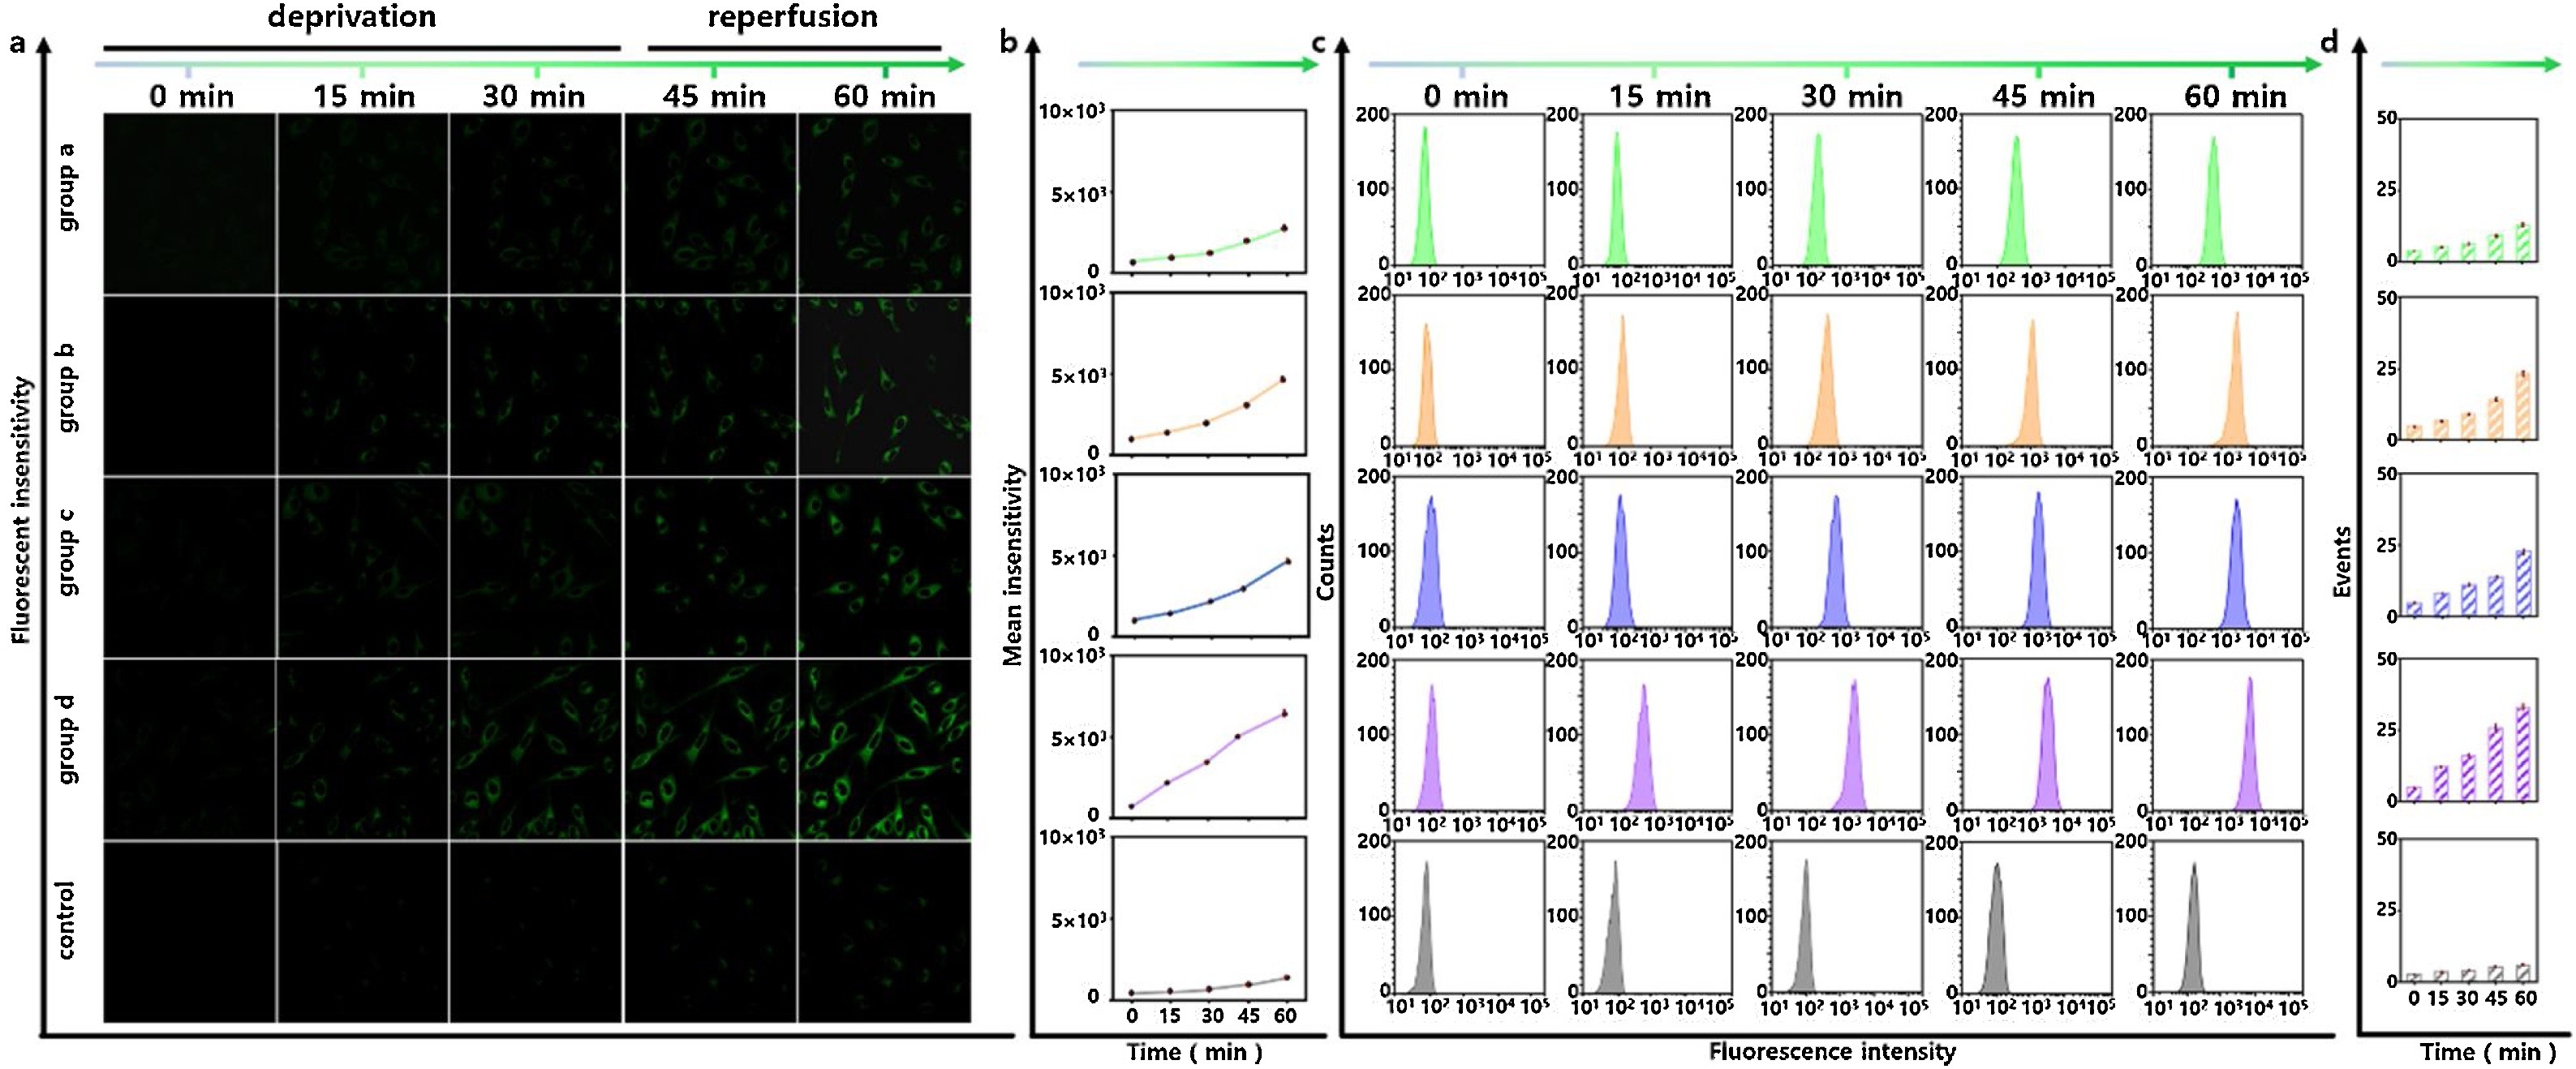
Fig. 4. Confocal microscopy imaging and flow cytometry assay of Zn2+ under HNO stimulation during cell I/R process. All the HT22 cells were incubated with CHP-H (1 μM) for 5 min then washed with fresh cell culture medium to remove excess probes and Angeli's Salt from solution. a) Confocal microscopy images of Zn2+ at deprivation time points at 0, 15, and 30 min. At the time point 0 min, 1 mM Angeli's Salt was added. HNO-regulation of five groups: group a, glucose deprivation; group b, serum deprivation; group c, oxygen deprivation; group d, glucose-serum-oxygen deprivation; control group. All the deprivation operations were subsequently recovered to normal culture conditions, reperfusion time points at 45, and 60 min. Fluorescence collection windows: λex = 880 nm, λem = 520–560 nm. Scale bars: 20 μm. b) The mean intensities of the imaging results in a). c) The results of flow cytometry analysis in a). d) Mean value of flow cytometry analysis in c). The data were shown as mean (±s.d.).
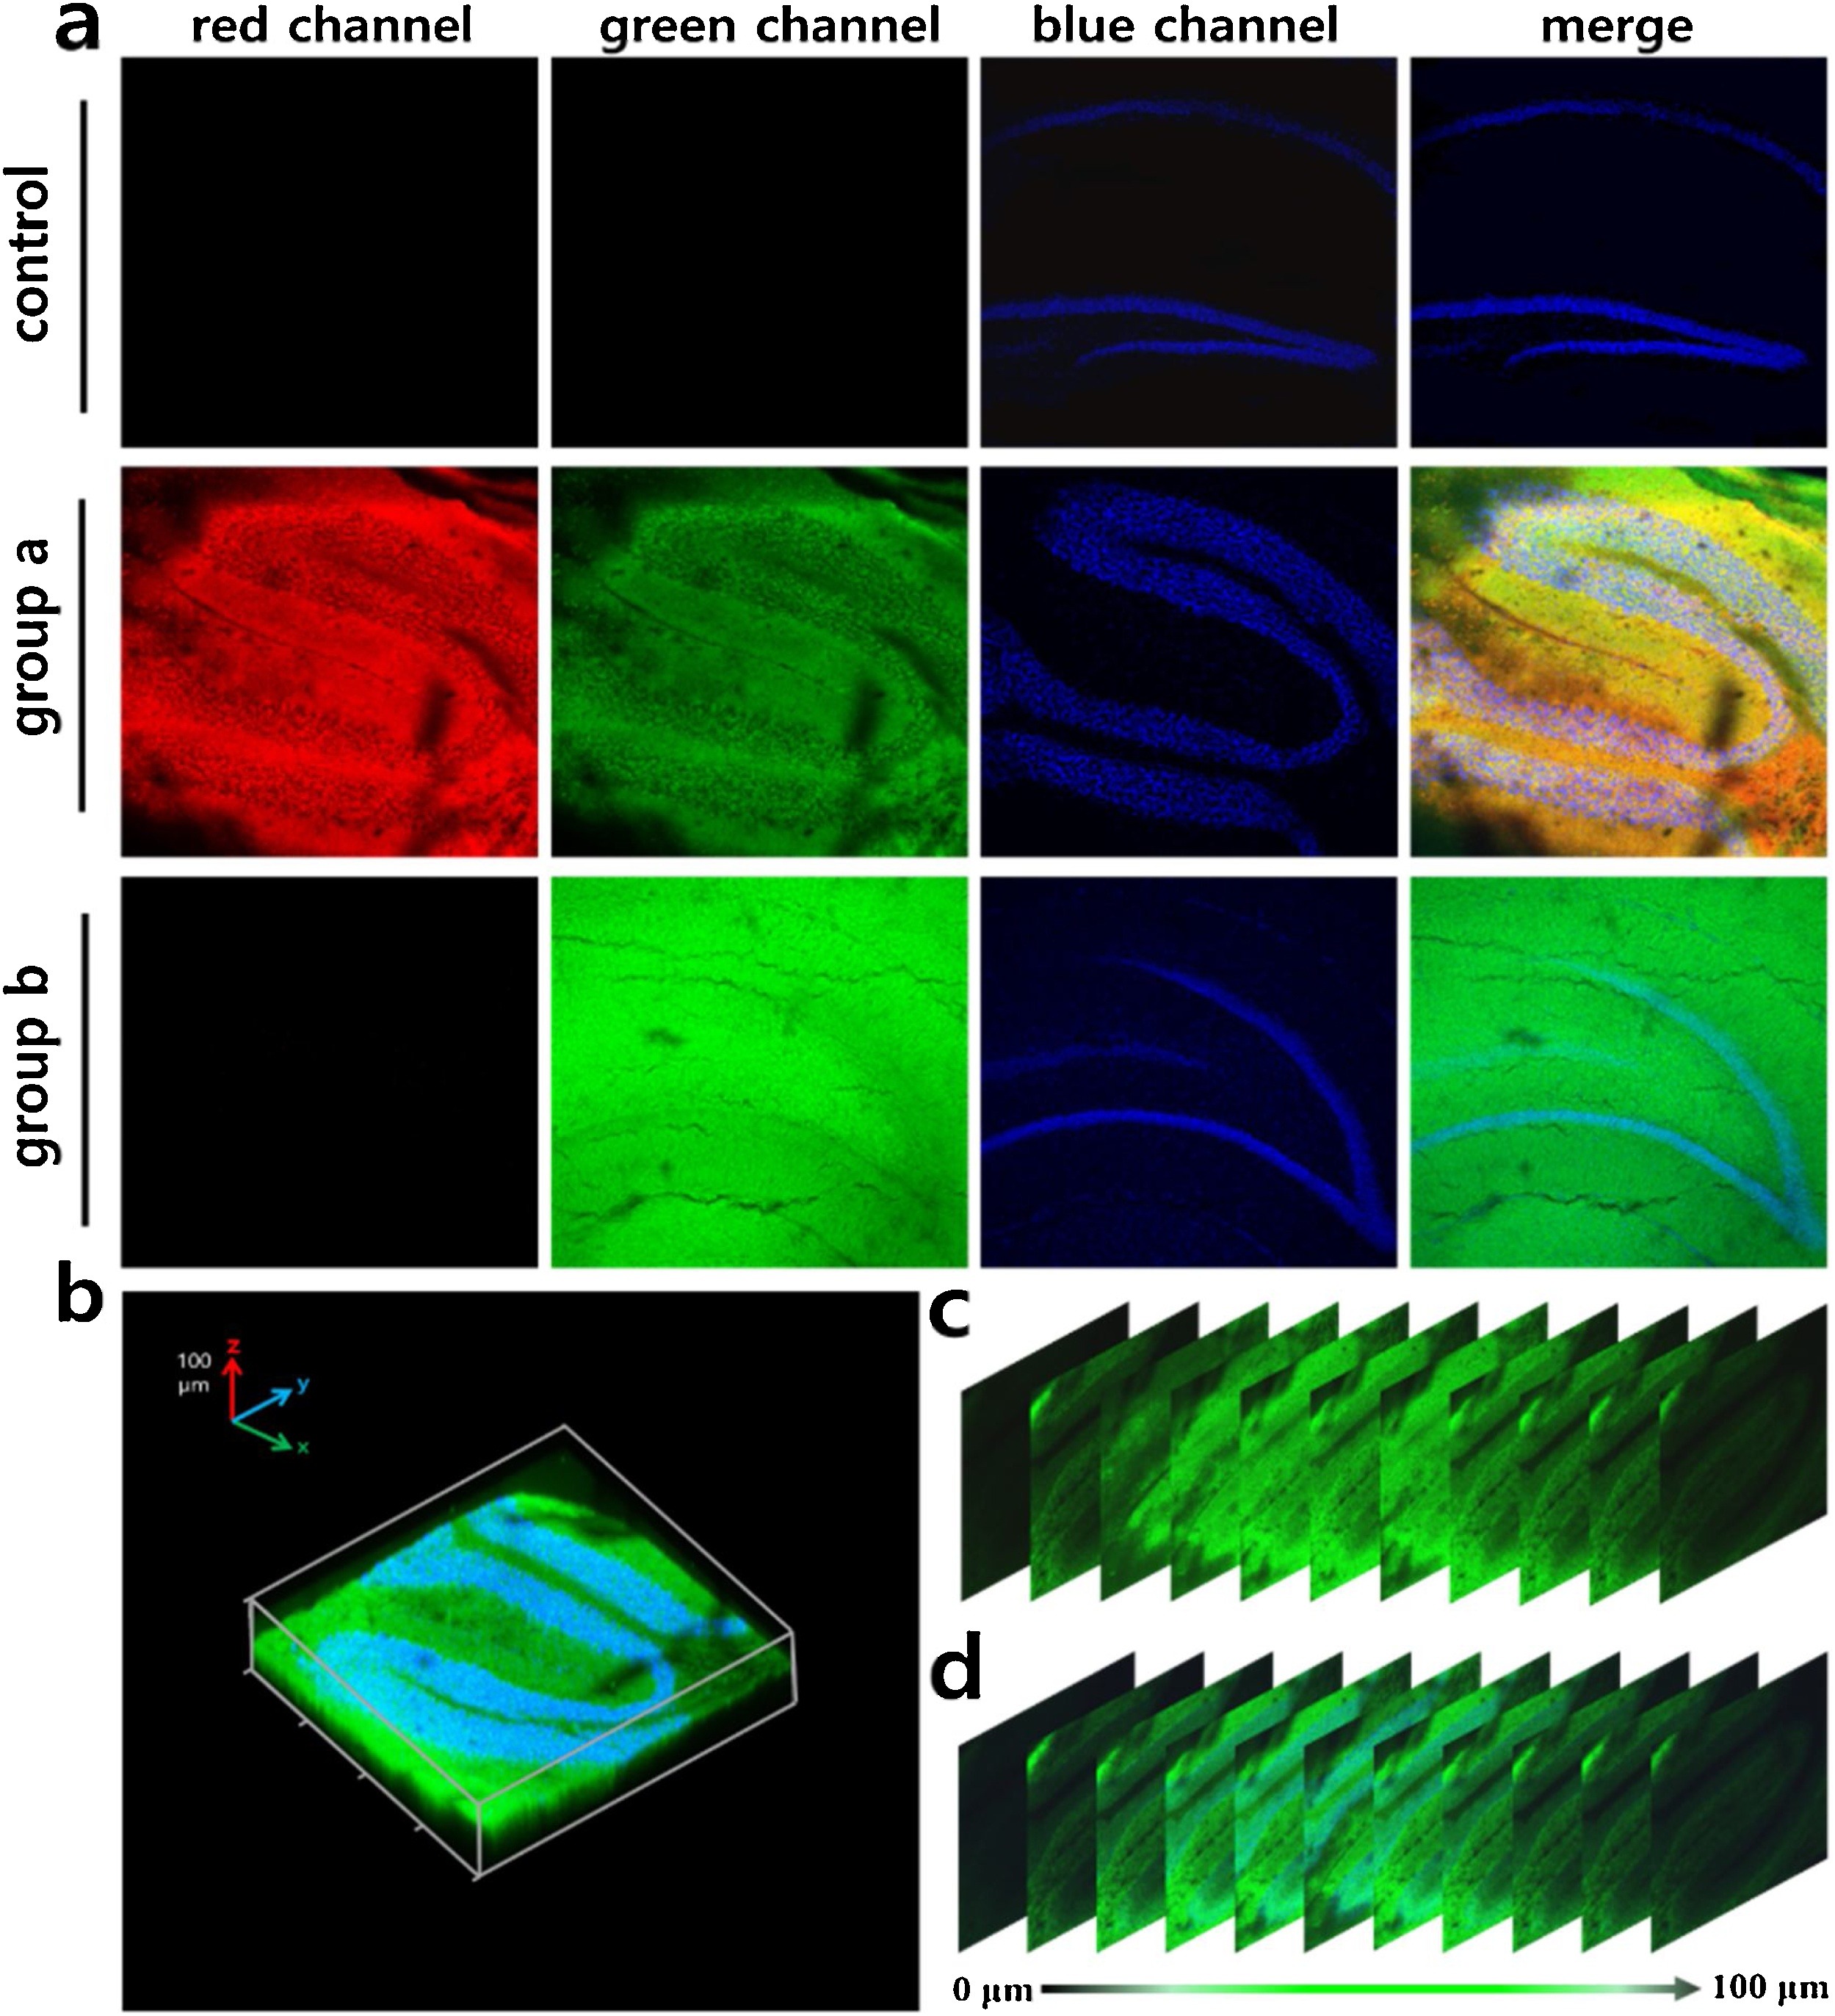
Fig. 5. Fluorescence imaging of brain hippocampus slices obtained from mice I/R models. The isolated hippocampus was from 3-week-old mice. The brain was embedded cryogenic cryopreservation and skived into 100 μm-thickness slices using a vibration slicer. Control: the slices were incubated with CHP-H (1 μM) for 20 min, Cyto-JN (5 μM) for 20 min, and DAPI (100 ng/mL) for 30 min in ACSF. Group a: the slice was treated with Angeli's Salt (1 mM) for 3 h in artificial cerebrospinal fluid (ACSF), washed three times with ACSF, then further incubated as described in control. Group b: the slice was pretreated with Zn2+ (25 μM) for 3 h and then treat as described in group a. a) Fluorescence imaging of hippocampus with probe CHP-H (1 μM), Cyto-JN (5 μM), and nucleus dye DAPI (100 ng/ml). And the overlay images showed the merge of red, green and blue channels. b) The three-dimensional (3D) reconstructed image of group a in green and blue channels. c) and d) The z-direction sequential images of hippocampus slice at a depth interval of 10 μm in green and green-blue channels. Fluorescence intensities collected in emission windows: Red channel (Cyto-JN) λex =680 nm, λem = 690–720 nm; green channel (CHP-H) λex =880 nm, λem = 510–550 nm; blue channel (DAPI) λex =405 nm, λem =.425–500 nm. (For interpretation of the references to colour in this figure legend, the reader is referred to the web version of this article.)
https://blog.sciencenet.cn/blog-2438823-1216582.html
上一篇:selenocysteine fluorescent probe for thyroid diseases
下一篇:海南医学院2020年临床医学学术型硕士和博士研究生招生
全部作者的其他最新博文
- • Triphenylamine-AIE Materials for Cancer Theranostics
- • Fluorescent Probe forRatiometric Monitoring of Peroxynitrite
- • Fluorescence Probe for Pathological Stages of Wound Healing
- • Macrophage M2 polarization to neurological damage
- • SERS-RCA biosensor for profiling dual miRNAs
- • a glutathione-activated near-infrared fluorescent probe