博文
罗阿蓉博士物种界定新作发表在Systematic Biology
||
题目:
Comparison of Methods for Molecular Species Delimitation across a Range of Speciation Scenarios
作者:
ARONG LUO1,2*, CHENG LING3, SIMON Y.W. HO2, AND CHAODONG ZHU1,4
1Key Laboratory of Zoological Systematics and Evolution, Institute of Zoology,Chinese Academy of Sciences, Beijing 100101, China
2School of Life and Environmental Sciences, University of Sydney, Sydney, New SouthWales 2006, Australia
3Department of Computer Science and Technology, College of Information Scienceand Technology, Beijing University of Chemical Technology, Beijing 100029, China4College of Life Sciences, University of Chinese Academy of Sciences, Beijing 100049,China
*Correspondence to be sent to: School of Life and Environmental Sciences, Universityof Sydney, Sydney, New South Wales 2006, Australia; E-mail:simon.ho@sydney.edu.au; Key Laboratory of Zoological Systematics and Evolution,Institute of Zoology, Chinese Academy of Sciences, Beijing 100101, China; E-mail:zhucd@ioz.ac.cn
Abstract:
https://academic.oup.com/sysbio/advance-article-abstract/doi/10.1093/sysbio/syy011/4866060Article (free access):
https://academic.oup.com/sysbio/advance-article/doi/10.1093/sysbio/syy011/4866060?guestAccessKey=40b3d965-626c-42c0-a141-efb17c4af09f
论文:Luo et al., 2018-Comparison of Methods for Molecular Species Delimitation across.pdf
数据:Data from Luo AR et al., 2018-Comparison of Methods for Molecular Species Delimi.zip
英文摘要与资助:
Species are fundamental units in biological research and can be defined on the basis of various operational criteria. There has been growing use of molecular approaches for species delimitation. Among the most widely used methods, the generalized mixed Yule-coalescent (GMYC) and Poisson tree processes (PTP) were designed for the analysis of single-locus data but are often applied to concatenations of multilocus data. In contrast, the Bayesian multispecies coalescent approach in the software BPP explicitly models the evolution of multilocus data. In this study, we compare the performance of GMYC, PTP, and BPP using synthetic data generated by simulation under various speciation scenarios. We show that in the absence of gene flow, the main factor influencing the performance of these methods is the ratio of population size to divergence time, while number of loci and sample size per species have smaller effects. Given appropriate priors and correct guide trees, BPP shows lower rates of species overestimation and underestimation, and is generally robust to various potential confounding factors except high levels of gene flow. The single-threshold GMYC and the best strategy that we identified in PTP generally perform well for scenarios involving more than a single putative species when gene flow is absent, but PTP outperforms GMYC when fewer species are involved. Both methods are more sensitive than BPP to the effects of gene flow and potential confounding factors. Case studies of bears and bees further validate some of the findings from our simulation study, and reveal the importance of using an informed starting point for molecular species delimitation. Our results highlight the key factors affecting the performance of molecular species delimitation, with potential benefits for using these methods within an integrative taxonomic framework.
This work was supported by the National Natural Science Foundation of China(grant number 31201701); the Youth Innovation Promotion Association of theChinese Academy of Sciences (2017118); and the Ministry of EnvironmentalProtection of China (grant number 2111101). A.L. was funded by a visitingscholarship from the Chinese Academy of Sciences to carry out research at theUniversity of Sydney. S.Y.W.H. was supported by a Future Fellowship from theAustralian Research Council. C.Z. acknowledges the support of the National ScienceFund for Distinguished Young Scholars (grant number 31625024).
中文摘要与资助:
物种是生物学研究最基础的单元。基于不同操作标准,物种的定义也各有不同。越来越多的研究工作中应用了分子物种界定方法。在最广泛使用的方法中,原来设计用于单个位点数据的GMYC和PTP,现在也经常被用于分析多位点联合数据。BPP软件中,贝叶斯多位点溯源方法对多位点数据进化则给出了明确的模型。
在这项研究工作中,我们在不同的物种操作标准下,模拟了一批数据集,对GMYC、PTP和BPP等三种方法进行了比较分析。研究结果发现,在没有基因交流的情况下,影响三种方法结果的主要因素为种群大小与分化时间的比例,而位点数量和每个物种的种群大小则影响较小。赋予合适的先验且准确的引导树,BPP高估或者低估物种的比例较低。除了在较高基因流存在的情况下,其它各种影响因子一般不会影响BPP稳健的结果。多个物种且不存在基因交流的情况下,单阈值GMYC和我们在PTP中发现的最佳策略给出的结果较好。在较少物种的情况下,PTP优于GMYC。和BPP相比,这两种方法都对基因交流和其它干扰因素比较敏感。熊类和蜜蜂类的实证数据进一步证实了我们数据模拟研究的一些发现,同时发现分子界定前物种信息的重要性。我们的结果突出展示了分子物种鉴定方法性能中的关键影响因素,将有助于学界同行在整合分类框架内应用这些方法。
罗阿蓉博士新作是Simon Ho教授和朱朝东研究员长期围绕分子系统学合作系列成果之一(Luo et al, 2018, Systematic Biology; Luo et al., 2010, BMC Evolutionary Biology; Luo et al., BMC Genomics, 2011)。此项工作主要得到国家自然科学基金委青年基金(31201701)、中国科学院青年创新促进会(2017118)和环境保护部生物多样性保护项目(2111101)资助。罗阿蓉博士得到中国科学院人事局资助,访问澳大利亚悉尼大学Simon Ho教授实验室并开展合作研究工作。Simon Ho教授受到澳大利亚研究基金会未来学者项目资助。朱朝东研究员得到国家杰出青年基金(31625024)项目资助。
合作论文目录:
1. A Luo, C Ling, SYW Ho, C Zhu. 2018. Comparison of Methods for Molecular Species Delimitation across a Range of Speciation Scenarios. Systematic Biology (10.1093/sysbio/syy011/4866060)
2. A Luo, H Lan, C Ling, A Zhang, L Shi, SYW Ho, C Zhu, 2015. A simulation study of sample size for DNA barcoding. Ecology and Evolution 5 (24), 5869-5879
3. A Luo, A Zhang, SYW Ho, W Xu, Y Zhang, W Shi, SL Cameron, C Zhu. 2011. Potential efficacy of mitochondrial genes for animal DNA barcoding: a case study using eutherian mammals. BMC Genomics 12 (1), 84
4. A Luo, H Qiao, Y Zhang, W Shi, SYW Ho, W Xu, A Zhang*, C Zhu* ,2010. Performance of criteria for selecting evolutionary models in phylogenetics: a comprehensive study based on simulated datasets. BMC Evolutionary Biology 10 (1), 242
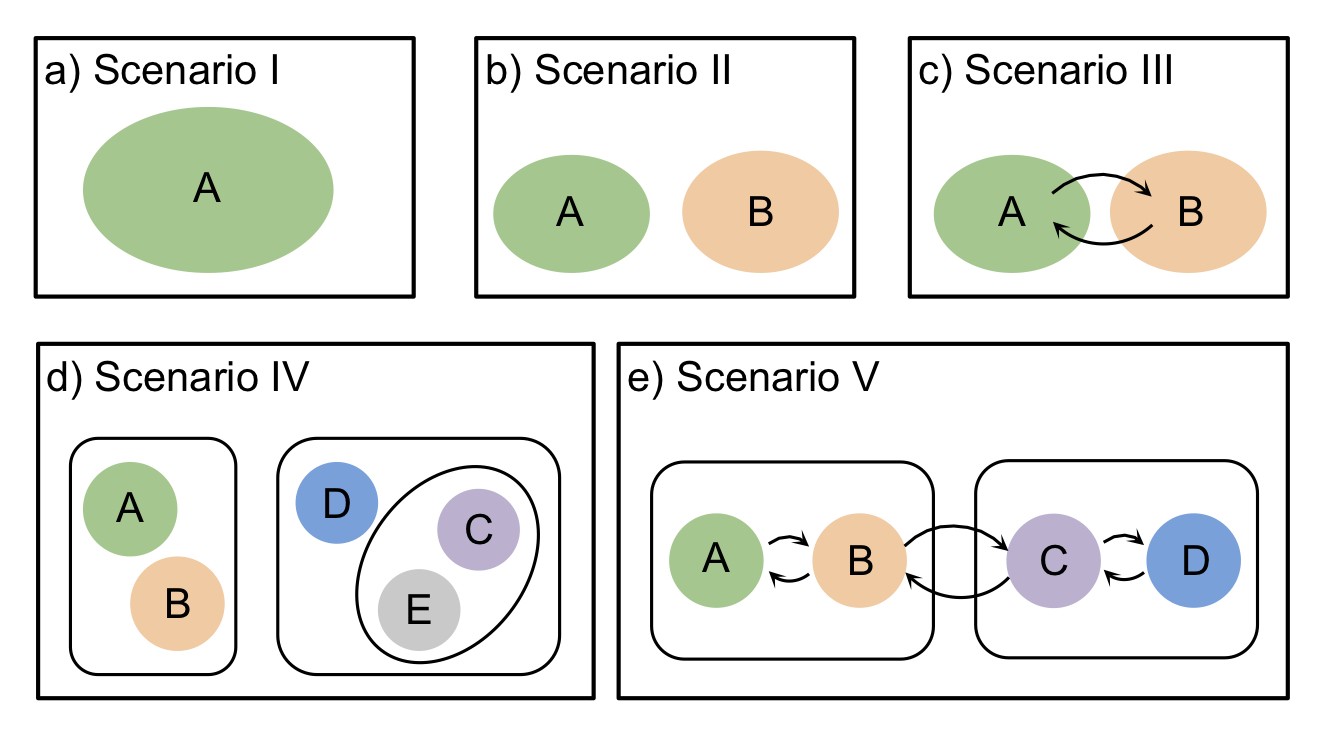
Figure 1. Five speciationmodels used for simulations in this study. (a) Scenario I: A single specieswithout population structure. (b) Scenario II: Speciation into two species,with cessation of gene flow. (c) Scenario III: Speciation into two species,with ongoing gene flow indicated by arrows. (d) Scenario IV: Speciation intofive species, with cessation of gene flow. (e) Scenario V: Speciation into fourspecies, with ongoing gene flow between adjacent species indicated by arrows.
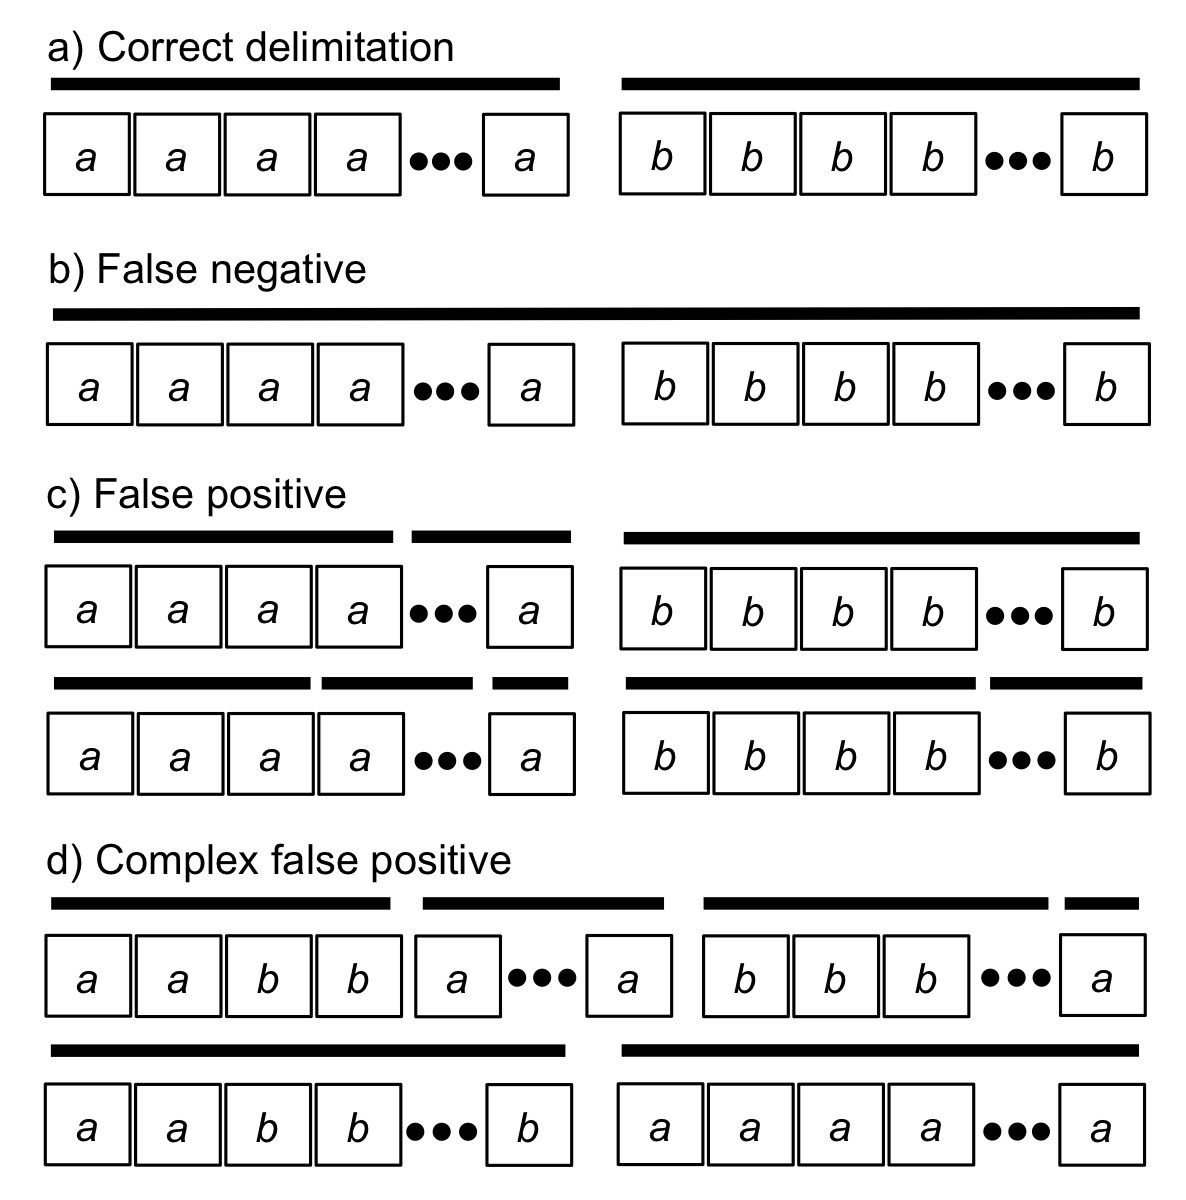
Figure 2. An illustrationof four categories used to classify the results of our species delimitations,for every species pair, by the generalized mixed Yule-coalescent (GMYC) and thePoisson tree processes (PTP) methods. Boxes with ‘a’ and ‘b’ represent individualsof simulated species A and B, respectively, with additional individuals impliedby the ellipses. Black bars above the boxes denote delimitation results; eachbar indicates an operational taxonomic unit (OTU). Two illustrative examples eachare given for false positives and for complex false positives.

Figure 3. Speciesdelimitations estimated by the Bayesian coalescent method in BPP. Boxplots areshown for posterior probabilities of the two-species delimitation model (P2), across every 10replicates under each set of conditions for Scenario II. Nine combinations (N, t)of population size N and divergencetime t are shown along the top,together with five values of sample size non the right. The x-axis represents the number of loci, while probabilities aregiven on the y-axis.

Figure 4. Speciesdelimitations estimated by GMYC for data sets from Scenario II. Panels shownine combinations of population size Nand divergence time t along the top,and four values of sample size n onthe right. The x-axis represents the number of loci. The y-axis represents thenumber of cases classified by correct delimitation (CD), false positive (FP),complex false positive (CFP), and not available (NA) among the 10 replicatesunder each set of conditions, which are denoted by different shades accordingto the legend in the bottom-right. No false negatives occurred in the resultsfrom Scenario II.

Figure 5. Speciesdelimitations estimated by the Bayesian PTP maximum likelihood (bPTP-ML) fordata sets from Scenario II. Panels show nine combinations of population size N and divergence time t along the top, and four values of samplesize n on the right. The x-axisrepresents the number of loci. The y-axis represents the number of casesclassified by correct delimitation (CD), false positive (FP), complex falsepositive (CFP), and not available (NA) among the 10 replicates under each setof conditions, which are denoted by different shades according to the legend inthe bottom-right. No false negatives occurred in the results from Scenario II.

Figure 6. (a) Posteriorprobabilities of the correct species delimitation model 1111 (P7)by BPP in Scenario IV. Probabilities are along the y-axis for every 10 replicatesof each number of loci (x-axis) combined with the speciation rates (indicated bytext above the boxplots). (b) Symbol plots of correct delimitations by GMYC inScenario IV. Yellow circles represent results from the 4 species pairs alongthe two basal branches, while blue circles represent results from the 6 speciespairs across the two basal branches. Relative areas of circles correspond tothe percentages of correct delimitations in the respective full delimitations (SupplementaryAppendix 12), with the maximum area indicating 100%. Symbols in (c) have thesame meaning as in (b), but show correct delimitations by bPTP-ML in ScenarioIV. (d) Correlogram of posterior probabilities inferred by BPP across 250 datasets in Scenario V. Diagonal lines running from top-left to bottom-right in thered panels below the diagonal and red pies above the diagonal denote negativecorrelation, whereas diagonal lines running from bottom-left to top-right inthe blue panels below the diagonal and blue pies above the diagonal denotepositive correlation. Darker colors indicate stronger relationships. Delimitationmodels are denoted by the character ‘m’ and numbers along the diagonal, such as‘m111’ for delimitation model 111.

Figure 7. Species delimitations estimatedfor a data set comprising 89 sequences from bears (genus Ursus). The maximum-likelihood tree is shown on the left. Thevertical bars, from left to right, indicate the OTUs inferred by BPP, bPTP-ML,Bayesian PTP heuristic (bPTP-h), PTP heuristic (PTP-h), and GMYC, respectively.Clades of different colors in the tree indicate the 10 taxa in the guide treefor BPP delimitation, and a collapsed clade at the bottom with the label‘HQ6859.._Ursus_arctos’ represents 34 sequences of Ursus arctos with accession numbers beginning with ‘HQ6859’ (SupplementaryAppendix 4).
随记:依然记得当年罗阿蓉博士论文答辩时,参会人数太多,临时调换会议室到动物研究所C101;依然记得她一次次学术上遇到挫折时的煎熬、挣扎和坚持。
好在阿蓉博士每一次孤独的坚持,都在既定轨道上有所进步。宝剑锋从磨砺出,梅花香自苦寒来。中国科学院动物研究所提供了科研人员可以稳坐冷板凳,安心做有意思问题的氛围。也期待研究组每位成员不忘十年寒窗基础,牢记生物系统学初心,静心培育自己的专业兴趣,努力实现自己的梦想!
祝贺阿蓉博士!
https://blog.sciencenet.cn/blog-536560-1100094.html
上一篇:张驰博士学术报告-20180206
下一篇:感恩宜兴湖㳇刘营春夫妇,兼记硕士生阶段野外工作