博文
2019年8月文献阅读总结
||
8月11日
1. Pseudouridylation of tRNA-Derived Fragments Steers Translational Control in Stem Cells
主讲人:王俊豪
Cristian Bellodi
Division of Molecular Hematology, Department of Laboratory Medicine, Lund Stem Cell Center, Faculty of Medicine, Lund University, Lund, Sweden
Highlights
•
•
PUS7 binds distinct tRNAs and controls biogenesis of tRNA-derived fragments (tRFs)
•
PUS7-mediated Ψ deploys specific tRFs (mTOGs) to repress translation in stem cells
•
PUS7 and mTOGs loss impairs early embryogenesis and impacts hematopoietic commitment
Summary
Pseudouridylation (Ψ) is the most abundant and widespread type of RNA epigenetic modification in living organisms; however, the biological role of Ψ remains poorly understood. 概述
Here, we show that a Ψ-driven posttranscriptional program steers translation control to impact stem cell commitment during early embryogenesis. 总览:我们展示了早期胚胎发生过程中假尿嘧啶化驱动的转录后翻译控制程序影响胚胎干细胞形成
Mechanistically, the Ψ “writer” PUS7 modifies and activates a novel network of tRNA-derived small fragments (tRFs) targeting the translation initiation complex. 机制:假尿嘧啶化writer蛋白PUS7改变并激活一个全新的tRF靶向翻译起始复合物的网络。
PUS7 inactivation in embryonic stem cells impairs tRF-mediated translation regulation, leading to increased protein biosynthesis and defective germ layer specification. 在胚胎干细胞中失活PUS7削弱了tRF介导的翻译调控,导致蛋白合成量增加和有缺陷的胚层
Remarkably, dysregulation of this posttranscriptional regulatory circuitry impairs hematopoietic stem cell commitment and is common to aggressive subtypes of human myelodysplastic syndromes. 应用:这一转录后调控路线的紊乱削弱了造血干细胞形成,并且在人类骨髓异常增生综合中的子型中普遍出现
Our findings unveil a critical function of Ψ in directing translation control in stem cells with important implications for development and disease. 意义
Introduction
Ψ is catalyzed by a family of evolutionarily conserved pseudouridine synthases (PUSs), which modify their RNA substrates as “stand-alone” enzymes or through an RNA-dependent mechanism that involves a multitude of antisense box H/ACA small nucleolar RNAs (snoRNAs) .假尿嘧啶化是由一系列进化保守的假尿苷合成酶(PUS)合成的,他们可以以独立的形式对RNA进行修饰,或者通过许多boxH/ACA结构介导靶RNA的修饰。

Results
PUS7 Ψ Synthase Activity Impacts Stem Cell Size and Protein Biosynthesis

Figure 1. PUS7 Governs Stem Cell Growth and Protein Synthesis Rates
(A) PUS7 is a stem cell-enriched Ψ synthase. Expression of PUS enzymes in human embryonic stem cells (hESCs) and fibroblasts (HFs). Right: Immunofluorescence shows nuclear localization of PUS7 in hESCs.
(B) Schematic of CRISPR/Cas9-based mutagenesis of PUS7. Characterization of one PUS7-KO hESC clone is shown.
(C) PUS7 loss does not affect pluripotency. Representative images of WT and PUS7-KO hESC colonies stained for alkaline phosphatase (AP), OCT4, and TRA-1-60. Heatmap shows expression levels of multiple pluripotency and lineage-specific markers in WT and PUS7-KO hESCs in four independent experiments. Color bar indicates normalized gene expression from +4 to −4 in log2 space. No statistical significant differences were measured (t test).
(D) Transmission electron micrographs of single cells reveal increased size of PUS7-KO hESCs. Scale bars, 5 μm. Close-up highlights nucleus (n) and cytoplasm(c) in WT and PUS7-KO cells. Graphs show mean cell surface and cytoplasm to nuclear area ratios ± SEM. ∗∗p < 0.01, ∗p < 0.05 (t test).
(E) Translation is increased in PUS7-KO hESC. De novo protein synthesis measured by 35S radioactive methionine/cysteine incorporation in WT and PUS7-KO cells ± wild-type (PUS7-WT) or Ψ catalytically inactive PUS7 allele (PUS7-D294A). Graph shows relative rate of protein synthesis ± SD in at least three independent experiments. ∗p < 0.05; NS, no statistical significance (t test).
PUS7 Binds Specific tRNA Isoacceptors in hESCs

Figure 2. iCLIP-Seq Delineates the Stem Cell-Specific PUS7 RNA Regulon
(A) Schematic of the iCLIP-seq approach employed to chart genome-wide PUS7-RNA interactions at the single-nucleotide resolution.
(B) Autoradiograph shows PUS7-bound RNA complexes. Anti-FLAG immunoprecipitates shows PUS7-RNA specific (lane 1) and non-specific interactions (lane 2).
(C) Pie chart shows distinct categories of RNA species bound to PUS7 in hESCs identified by iCLIP-seq.
(D) Sequence analysis of PUS7-specific iCLIP products identifies a new putative PUS7-RNA-binding motif.
(E) Pie chart shows enrichment of individual PUS7-bound tRNAs identified by iCLIP-seq normalized to their abundance in hESCs determined by smRNA-seq.
Importantly, we did not observe significant differences in the frequency of individual mature tRNA isoacceptors including tRNA-Tyr (GUA), a primary PUS7 target in eukaryotic cells
PUS7-Mediated Ψ Directs tRNA-Derived Small RNAs to Inhibit Translation
Intriguingly, specific categories of tRFs processed from 5′ ends of tRNAs function as potent inhibitors of protein synthesis (Kumar et al., 2016). Building upon these studies and our findings that tRNA abundance is unperturbed by PUS7 loss, we investigated whether underlying tRF dysfunctions contributed to the translational alterations in PUS7-depleted cells, , we investigated whether underlying tRF dysfunctions contributed to the translational alterations in PUS7-depleted cells. We interrogated smRNA-seq libraries generated using RNA from WT and PUS7-KOhESCs for differences in the major categories of tRFs including 5′/3′-derived tRFs (5′tRF and 3′tRF) and internal-derived tRFs (int-tRF) (Loher et al., 2017). Strikingly, we identified specific tRF subsets significantly altered in PUS7-KO cells, which were primarily processed from the 5′ end of specific cognate tRNAs (Figure 3A; Table S2).
Furthermore, we uncovered that 5′tRFs derived from tRNA containing a 5′ terminal oligoguanine (TOG), such as tRNA-Ala, tRNA-Cys, and tRNA-Val, were significantly depleted in PUS7-KO cells (Figures 3B, S4E, and S4F). Since TOG-containing fragments were previously shown to potently repress translation (Ivanov et al., 2011), we further examined how PUS7 regulated this specific 5′tRF subgroup. Interestingly, the largest fraction of hESCs-enriched TOG-containing tRFs peaked at 18-mer; we denoted these small endogenous 5′tRFs as mini TOGs (mTOGs) given their short length (Figures 3C and 3D). The smRNA-seq data was verified using sequence-specific qRT-PCR, illustrating a drastic reduction (∼50%) of mTOGs in PUS7-KO cells (Figures 3E, S4F–S4H, and S5F). This effect was specific as add-back of PUS7 completely rescued mTOGs levels, indicating that PUS7 may contribute to their biogenesis(Figure 3E). Furthermore, sequence analysis revealed that mTOGs share the specific PUS7 Ψ-consensus motif containing the uridine residue at position 8 (U8) as a new predicted target residue for modification (Figure 3D). To reveal that the predicted U8 position was highly Ψ in hESCs, we employed a modified version of a highly sensitive enzymatic-based method, denoted as SCARLET (site-specific cleavage and radioactive-labeling followed by ligation-assisted extraction and thin-layer chromatography) (Liu et al., 2013) (Figure 3F). This was validated using a CMCT-based protocol optimized to accurately detect endogenous mTOG Ψ8 levels (Persson et al., 2009, Schwartz et al., 2014) and demonstrate that this modification was PUS7 dependent (Figures S5A–S5C).
Although predicted to harbor various types of RNA modifications, it is unknown how specific RNA epigenetic “marks” affect tRFs function. Having established that PUS7 modifies mTOGs, we next examined whether Ψ was required for translational regulation. Thus, we measured protein synthesis in PUS7-KO hESCs transduced with differentially Ψ synthetic mTOG oligos. Strikingly, we uncovered that only mTOG-Ψ8 restored protein synthesis to control levels in these cells (Figures 3G and S5G). This effect was not due to differences in mTOG levels, stability, or aspecific response induced by transduction of Ψ-modified oligonucleotides (Figures S5D and S5E). Together, these results suggest that Ψ is critically required for 5′tRF-dependent translational repression in vivo.

Figure 3. Pseudouridylation of Specific 5′tRFs Fine Tunes Translation in hESCs
(A) PUS7 loss affects specific tRFs subgroups. Quantile-quantile plot of expected and observed –log10 Benjamini and Hochberg (BH) adjusted P value. Inverted –log10 P value is shown for tRFs depleted in PUS7-KO cells. Each dot represents a unique fragment type grouped by individual tRNA isoacceptors. Statistically significant enriched (red) or depleted (blue) tRFs (P adj.<0.05) in PUS7-KO over control cells are shown. Right: Pie chart groups the major categories of differentially expressed tRFs in PUS7-KO cells.
(B) Violin plot shows the mean difference (PUS7-KO to WT) in normalized counts for each 5′tRF measured by smRNA-seq. tRF classification is based on MintMAP (Loher et al., 2017). 5′tRF with five consecutive guanine residues are classified as 5′TOG. BH adjusted P value (p < 0.001) shows statistically significant depletion of 5′TOG tRFs in PUS7-KO cells.
(C) Graph shows length distribution of individual 5′TOG tRFs relative to their abundance in hESCs. Highlighted is the peak corresponding to mTOG.
(D) Schematic depicts the structure of tRNA Ala/Cys/Val with the mTOG sequence (blue). The PUS7 Ψ-consensus motif (yellow), target Ψ (red), and RNA-binding motif (green) are highlighted.
(E) PUS7 regulates mTOG levels in hESCs. Graph shows mean mTOG expression levels in WT and PUS7-KO hESCs ± SD in three independent experiments measured by stem-loop specific qPCR. ∗∗p < 0.01; NS, no statistical significance (t test).
(F) mTOGs are extensively pseudouridylated in hESCs. Synthetic oligos with or without Ψ are employed as standards (Std) to determine the position of U and Ψ nucleotides on the TLC plate during SCARLET. Endogenous levels of mTOG Ψ modification at position 8 (Ψ8) in hESCs are shown (bottom right).
(G) Global protein synthesis measured by puromycin incorporation in WT and PUS7-KO hESCs transduced with 50 nM scramble control and mTOG-Ψ8 or mTOG-U8 oligos. Graph shows relative rate of protein synthesis ± SD in three independent experiments. ∗∗p < 0.01 (t test).

Figure S5. Characterization of PUS7-Dependent mTOG Pseudouridylation in hESCs, Related to Figures 3 and 4
(A) Schematic shows N-cyclohexyl-N′-(2-morpholinoethyl)-carbodiimid metho-p-toluolsulfonate (CMCT)-based qPCR approach adapted from the original primer extension to measure relative mTOG Ψ levels in WT and PUS7-KO hESCs (Bakin and Ofengand, 1993, Schwartz et al., 2014). CMCT binds to Ψ and stops cDNAsynthesis one nucleotide 3′ end of the modified residue. Following the ligation of the 5′-adaptor, the small RNA fraction is treated with or without CMCT and cDNA synthesized using mTOG sequence-specific stem-loop primer (Persson et al., 2009, Schwartz et al., 2014). Finally, relative quantification of the PCR product obtained using primers spanning the Ψ site is performed. The presence of Ψ leads to the accumulation of truncated cDNA, which results in very low amplification of the final PCR product compared to the CMCT-untreated RNA sample.
(B) Quantification of mTOG Ψ levels shows CMCT-specific inhibition of cDNA synthesis, in WT but not in PUS7-KO hESCs.
(C) The levels of small nuclear RNA U2 Ψ are not affected in PUS7-depleted cells. PCR primers spanning 10 Ψ sites on U2 were used as a positive control for the CMCT-treatment. Graph shows relative levels of U2 Ψ modification ± SD in WTand PUS7-KO hESCs in three independent experiments. ∗∗p < 0.01, NS, no statistical significance (t test).
(D) Sequence-specific stem-loop primer RT-qPCR quantification illustrates no differences in the levels of Ψ8-modified or unmodified synthetic mTOG oligos 2, 4 and 6 days after transfection in hESCs. Graph shows relative mTOGs levels ± SD in three independent experiments. NS, no statistical significance (t test).
(E) Translation regulation mediated by mTOG-Ψ8 is specific. Transfection of a scramble Ψ8-modified oligonucleotide does not rescue aberrant protein synthesisrates in PUS7-KO cells. 35S radioactive Methionine/Cysteine incorporation in WTand PUS7-KO hESCs ± scramble control-Ψ8 modified 18-mer oligonucleotide.
(F) Stem-loop RT qPCR analysis show reduced mTOG expression in PUS7-KO2hESCs. Graph shows relative mTOGs levels ± SD in three independent experiments. ∗∗p < 0.01 (t test).
(G) mTOG-Ψ8 specifically restores increased protein synthesis levels in PUS7-KO2 hESCs. 35S radioactive Methionine/Cysteine incorporation in PUS7-KO2cells ± mTOG-U8 or mTOG-Ψ8.
(H) eIF4F assembly is enhanced in PUS7-KO2 hESCs. Protein analysis shows increased binding of eIF4G/A to eIF4E:m7G Sepharose beads in PUS7-KO2 cells.
(I and J) No differences in the overall amount (inputs) of eIF4G/A/E were measured between the different conditions/genotypes. Graphs show log2 FC ± SD of KO/WTand mTOG-U8 or mTOG-Ψ8 to CTR, respectively, in three independent experiments. NS, no statistical significance (t test).
Pseudouridylated mTOG Inhibits Translation Initiation
Previous evidence suggests that stress-induced TOG-containing 5′tRFs impaired translation initiation by displacing eIF4A and eIF4G from the mRNA 7-methyl-guanylate cap (m7G), one of the earliest rate-limiting steps of translation initiation (Ivanov et al., 2011). Hence, we performed cap-binding assays based on the rationale that translation initiation may be favored by loss of PUS7.

Figure 4. Pseudouridylated mTOG Targets the Translation Initiation Complex
(A and B) eIF4F assembly is enhanced in PUS7-KO hESCs and selectively regulated by mTOG-Ψ8 expression. 7-methyl-guanosine (m7GTP) pull-down assays illustrate eIF4G/A recruitment to eIF4E:m7GTP Sepharose beads in lysates from WT and PUS7-KO hESCs ± mTOG-Ψ8 or mTOG-U8. Graphs show mean log2 fold change (FC) ± SD of cap-bound eIF4E/G/A in at least three independent experiments. ∗p < 0.05, ∗∗p < 0.01; NS, no statistical significance (t test).
(C) Genetic strategy to inhibit eIF4E activity in PUS7-KO hESCs. Expression of a doxycyclin-inducible 4EBP1 mutant (4EBP1M) completely rescues protein synthesis in PUS7-KO hESCs. Graph shows relative rate of protein synthesis ± SD with or without 4EBP1M in four independent experiments. ∗∗p < 0.01; NS, no statistical significance (t test).
(D) Schematic depicts the unbiased approach employed to identify protein complexes bound to 3′-biotynilated mTOG-Ψ8 or control oligos in vivo. Oligo-specific protein complexes are immunoprecipitated using streptavidin beads and subjected to MS-based quantitative proteomics. Heatmap shows proteins enriched in mTOG-Ψ8 immunoprecipitates in both PUS7-KO HEK293T and hESCs. Columns are individual experiments. Color bar indicates protein score (IBAQ value) from +4 to +8 in log10 space. Gray, not detected (ND).
(E) Ψ promotes mTOG-PABPC1 complex formation. mTOG-binding proteins are co-precipitated using 3′-biotynilated control and mTOG-Ψ8 or mTOG-U8 in PUS7-KO hESCs. Graph shows log2 FC mTOG-Ψ8/U8 binding ± SD in three independent experiments. ∗p < 0.05, ∗∗p < 0.01; NS, no statistical significance (t test).
(F) mTOGs inhibit PABPC1 recruitment to eIF4F in vivo. Levels of PABPC1 co-precipitated using m7GTP Sepharose beads are increased in PUS7-KO hESCs and can be restored by mTOG-Ψ8 expression. Graph shows mean levels ± SD of cap-bound PABPC1 in three independent experiments. ∗p < 0.05 (t test); NS, no statistical significance (t test).
(G) PABPC1 is critical for mTOG-dependent translational repression. Graph shows relative rate of protein synthesis ± SD in WT and PUS7-KO hESCs transduced with control and PABPC1-targeting siRNAs ± mTOG-Ψ8 in at least four independent experiments. ∗∗p < 0.01; NS, no statistical significance (t test).
2. PIWI-interacting RNAs: small RNAs with big functions
主讲人:陈志荣
Phillip D. Zamore
RNA Therapeutics Institute and Howard Hughes Medical Institute, University of Massachusetts Medical School, Worcester, MA, USA
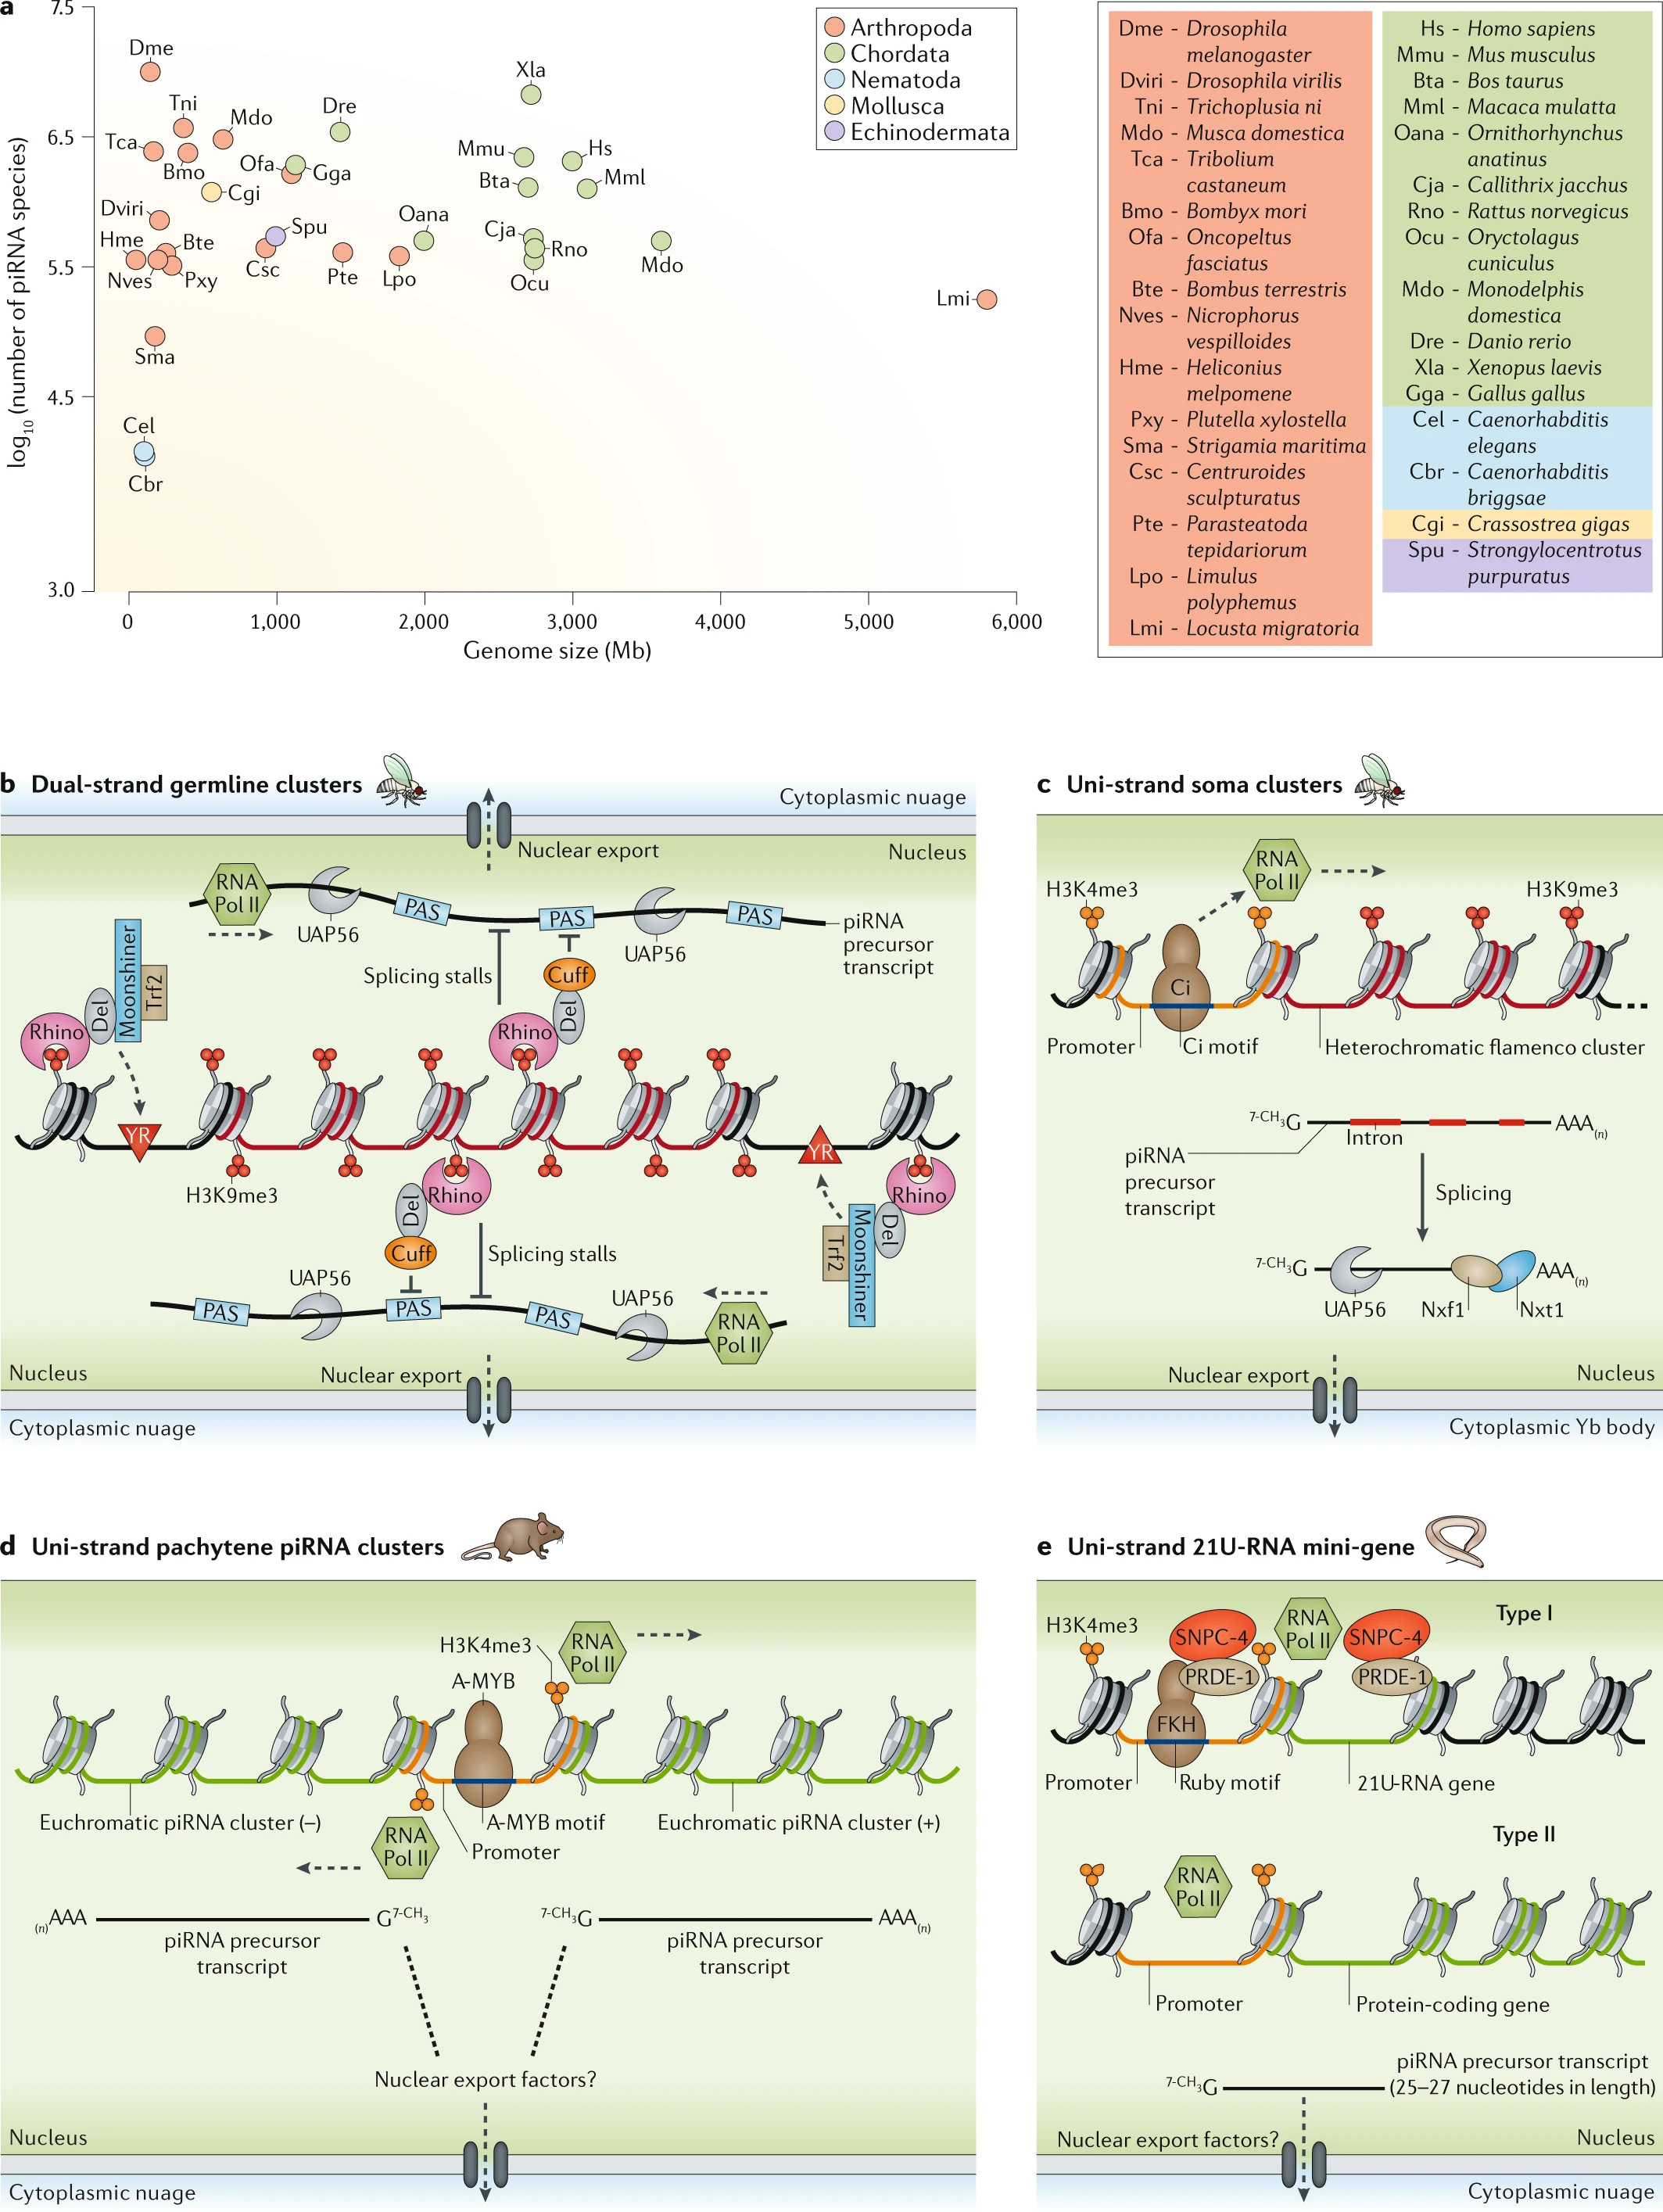
Fig. 1: Genomic sources of piRNAs.
a | Genome size and the number of PIWI-interacting RNA (piRNA) species do not correlate. b | Fly germline dual-strand clusters exhibit ‘incoherent’ transcription where the histone H3 lysine 9 trimethylation (H3K9me3) repressive mark is recognized by Rhino. Rhino forms a complex with Deadlock (Del) and Cutoff (Cuff). Rhino–Del recruits Moonshiner and TATA box-binding protein-related factor 2 (Trf2) to the pyrimidine–purine (YR) elements to initiate promoter-independent transcription. Rhino–Del–Cuff ensures transcriptional elongation by repressing splicing and termination at polyadenylation signal sequences (PASs) within the clusters. Thereafter, piRNA precursor transcripts are routed to nuage by UAP56. 果蝇生殖系统双向转录簇含有不连续的转录。Rhino蛋白识别染色体上的转录抑制信号H3K9me3,结合DEL合cutoff构成复合体,从而招募Moonshiner合Trf2到YR元件上起始转录(不依赖于promoter),此外,该复合体还可以确保转录延伸,通过抑制剪切和PAS序列终止信号。c | The uni-strand flamenco cluster resides in heterochromatin but is conventionally transcribed from a promoter element recognized by the protein Cubitus interruptus (Ci). Splicing of piRNA precursor transcripts generates several isoforms that are shuttled to cytoplasmic Yb bodies by UAP56 and the exportins Nxf1 and Nxt1. 果蝇单链异染色质区域的flamenco簇通过Ci识别启动子的方式连续正常转录,剪切后被UAP56,NXF1,NXT1运往细胞质的Yb体d | Mouse pachytene piRNA clusters are transcribed from canonical promoters. A-MYB drives their transcription bidirectionally or unidirectionally at the onset of meiosis. 小鼠粗线期piRNA簇被正常转录,A-MYB驱动减数分裂时期启动双向或单向转录e | Caenorhabditis elegans type I 21U-RNAs are individually transcribed from mini-genes by the protein Forkhead family transcription factor (FKH), which binds the Ruby motif upstream of each piRNA precursor. The A-MYB-like transcription factor SNPC-4 — recruited by PRDE-1 — enhances transcription. Transcription of type II 21U-RNAs initiates at the promoters of full-length protein-coding genes. RNA Pol II, RNA polymerase II.线虫21u-rna通过FKH靶向ruby motif上游从piRNA前体小基因中独立转录。SNPC-4被PRDE-1招募增强转录
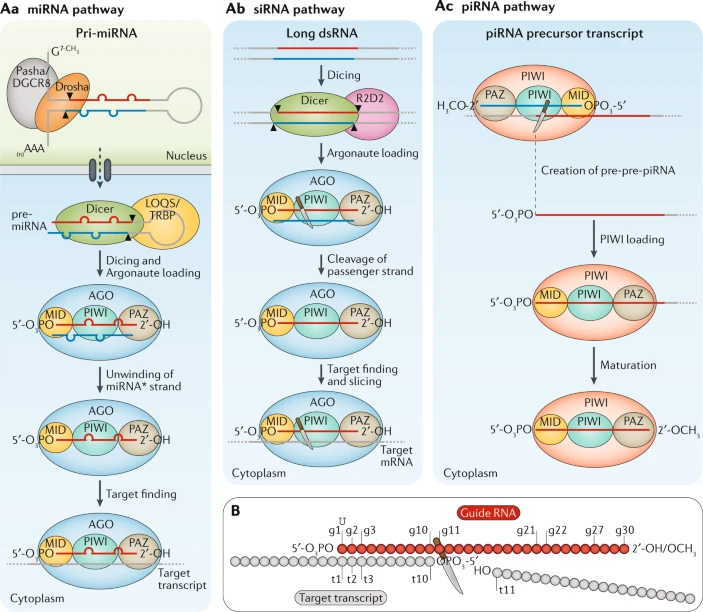
Box 1 Argonaute family proteins
3. Single-cell RNA sequencing technologies and bioinformatics pipelines
主讲人:陈志荣
Duhee Bang
Department of Chemistry, Yonsei University, Seoul, Korea
8月17日
The Cancer Genome Atlas Comprehensive Molecular Characterization of Renal Cell Carcinoma
主讲人:王俊豪
W. Marston Linehan
Urologic Oncology Branch, National Cancer Institute, Center for Cancer Research, Bethesda, MD 20892, USA


Figure 1. Comparison of RCC Histologic Subtypes
(A) Heatmap representation of chromosomal copy number and RNA expression profiles between the different histologic RCC subtypes. Chromosomal copy number data are ordered by chromosomal arm in descending order (red, gain; blue, loss). The relative RNA expression was assessed for the most variable probes within the complete RCC cohort for either mRNA (n = 500), miRNA (n = 249), or lncRNA (n = 178) (red, increased; blue, decreased). RCC samples were arrayed left to right based on histologic subtype (ccRCC, green; type 1 PRCC, light blue; type 2 PRCC, orange; unclassified [Unc.] PRCC, gray; CIMP-RCC, red; ChRCC, purple), then tumor stage (stage I, light green; stage II, yellow; stage III, orange; stage IV, red), and then vital status (alive, white; deceased, black).
(B) Percentage of chromosomal copy number alterations between the different histologic RCC subtypes.
(C) Differences in patient overall survival between the different histologic RCC subtypes (log-rank p value).

Figure 2. Gene and Pathway Alteration Associates with Survival Predictions in Specific RCC Subtypes
(A) Differences in patient overall survival within histologic RCC subtypes (ccRCC, green; PRCC, blue; ChRCC, purple) dependent upon gene mutation (log-rank p value).
(B) Oncoprints for CDKN2A gene deletions, hypermethylation, and mutations for the histologic RCC subtypes (ccRCC, green; type 1 PRCC, light blue; type 2 PRCC, orange; Unc. PRCC, gray; CIMP-RCC, red; ChRCC, purple). Mutations were segregated into nonsense (red) and missense (blue).
(C) Differences in patient overall survival within the histologic RCC subtypes (ccRCC, green; type 1 PRCC, light blue; type 2 PRCC, orange; ChRCC, purple) dependent upon CDKN2A alteration (log-rank p value).
(D) Chromatin remodeling pathway mutation frequency within histologic RCC subtypes (ccRCC, green; PRCC, blue; ChRCC, purple). Abbreviations: Me, histone methylation; Ac, histone acetylation; Ub, histone ubiquitination.

Figure 3. Hypermethylation Patterns Associate with Survival Predictions
(A) Heatmap representation of the clustering of 1,532 highly variable DNA methylation probes that were unmethylated in the normal tissues. A methylation β-value ≥ 0.3 was considered hypermethylated. Tumors were annotated for histologic RCC subtype (ccRCC, green; type 1 PRCC, light blue; type 2 PRCC, orange; Unc. PRCC, gray; CIMP-RCC, red; ChRCC, purple), tumor stage (stage I, light green; stage II, yellow; stage III, orange; stage IV, red), vital status (alive, white; deceased, black), and DKK1 (cg07684796) and SFRP1 (cg15839448) hypermethylation (hypermethylated, dark green).
(B) Differences in patient overall survival within the histologic RCC subtypes (ccRCC, green; PRCC, blue; ChRCC, purple) dependent upon methylation cluster (log-rank p value).
(C) Differences in patient overall survival within ccRCC and ChRCC tumors (ccRCC, green; ChRCC, purple) dependent upon hypermethylation of either SFRP1or DKK1 (log-rank p value).

Figure 4. RCC Histologic Subtypes Associate with Specific mRNA Signatures
(A) Heatmap representation of the comparison of mRNA expression signatures for major cellular processes between the different histologic RCC subtypes (ccRCC, green; type 1 PRCC, light blue; type 2 PRCC, orange; Unc. PRCC, gray; CIMP-RCC, red; ChRCC, purple). Tumor stage (stage I, light green; stage II, yellow; stage III, orange; stage IV, red) and vital status (alive, white; deceased, black) are indicated above the heatmap.
(B) Heatmap representation showing the relationship between gene expression modules and clinical features. Red heatmap shading indicates a positive correlation between a gene module and a clinical feature and blue heatmap shading represents a negative correlation.

Figure 5. Metabolic Analysis of RCC Histologic Subtypes
(A) Schematic of metabolic pathway genes selected for metabolic analysis.
(B) Heatmap representation of the comparison of mRNA expression signatures for the selected metabolic processes between the different histologic RCC subtypes (ccRCC, green; type 1 PRCC, light blue; type 2 PRCC, orange; Unc. PRCC, gray; CIMP-RCC, red; ChRCC, purple). Tumor stage (stage I, light green; stage II, yellow; stage III, orange; stage IV, red) and vital status (alive, white; deceased, black) are indicated above the heatmap.
(C) Comparative expression of the ribose sugar metabolism signature between the different histologic RCC (ccRCC, green; ccRCC stage I/II, dark blue; ccRCC stage III/IV, dark red; type 1 PRCC, light blue; type 2 PRCC, orange; Unc. PRCC, gray; CIMP-RCC, red; ChRCC, purple).
(D) Differences in patient overall survival within ccRCC dependent upon expression of the ribose sugar metabolism signature (log-rank p value).
(E) Comparative expression of the Krebs cycle, ETC Complex III, AMPK, and ribose sugar metabolism gene signatures between ChRCC and metabolically divergent (MD) ChRCC (ChRCC, purple; MD-ChRCC, pink).
(F) Differences in patient overall survival between ChRCC and MD-ChRCC (log-rank p value).

Figure 6. Immune Signature Analysis
(A) Supervised clustering of immune gene signature (IGS) expression by individual sample (left) or mean IGS expression (right) for the different histologic RCC subtypes (ccRCC, green; PRCC, blue; ChRCC, purple).
(B) Comparative expression of the Th2 gene signature between the histologic RCC subtypes (ccRCC, green; PRCC, blue; type 1 PRCC, light blue; type 2 PRCC, orange; CIMP-RCC, red; unclassified PRCC, gray; ChRCC, purple) (t test).
(C) Comparative differences in patient overall survival within the histologic RCC subtypes (ccRCC, green; PRCC, blue; type 2 PRCC, orange; ChRCC, purple) dependent upon the Th2 gene signature (log-rank p value).
Small tRNA-derived RNAs are increased and more abundant than microRNAs in chronic hepatitis B and C.
主讲人:郑凌伶
Scientific Reports volume 5, Article number: 7675 (2015)
Praveen Sethupathy
Bioinformatics and Computational Biology Curriculum, University of North Carolina at Chapel Hill, Chapel Hill, North Carolina, United States of America
Abstract
We used high throughput sequencing to conduct an unbiased profiling of small (14-40 nts) RNAs in liver from Japanese subjects with advanced hepatitis B or C and hepatocellular carcinoma (HCC).
Small RNAs derived from tRNAs, specifically 30–35 nucleotide-long 5′ tRNA-halves (5′ tRHs), were abundant in non-malignant liver and significantly increased in humans and chimpanzees with chronic viral hepatitis. 5′ tRH abundance exceeded microRNA abundance in most infected non-cancerous tissues.
in matched cancer tissue, 5′ tRH abundance was reduced, and relative abundance of individual 5′ tRHs was altered. In hepatitis B-associated HCC, 5′ tRH abundance correlated with expression of the tRNA-cleaving ribonuclease, angiogenin.
These results demonstrate that tRHs are the most abundant small RNAs in chronically infected liver and that their abundance is altered in liver cancer.
5' tRH在非恶性肝炎中高表达,并且在慢性肝炎中显著上升。
在肝癌组织中5'tRH表达水平下降,其表达水平与tRNA切割酶angiogenin相关
tRH是肝脏慢性感染中最丰富的小RNA(超过microRNA),其表达水平在肝癌中有所改变
8月24日
Massively parallel single-cell chromatin landscapes of human immune cell development and intratumoral T cell exhaustion
主讲人:黄子亮
Nature Biotechnologyvolume 37, pages925–936 (2019)
Howard Y. Chang
Center for Personal Dynamic Regulomes, Stanford University School of Medicine, Stanford, CA, USA
Abstract
Understanding complex tissues requires single-cell deconstruction of gene regulation with precision and scale. Here, we assess the performance of a massively parallel droplet-based method for mapping transposase-accessible chromatin in single cells using sequencing (scATAC-seq). We apply scATAC-seq to obtain chromatin profiles of more than 200,000 single cells in human blood and basal cell carcinoma. In blood, application of scATAC-seq enables marker-free identification of cell type-specific cis- and trans-regulatory elements, mapping of disease-associated enhancer activity and reconstruction of trajectories of cellular differentiation. In basal cell carcinoma, application of scATAC-seq reveals regulatory networks in malignant, stromal and immune cells in the tumor microenvironment. Analysis of scATAC-seq profiles from serial tumor biopsies before and after programmed cell death protein 1 blockade identifies chromatin regulators of therapy-responsive T cell subsets and reveals a shared regulatory program that governs intratumoral CD8+ T cell exhaustion and CD4+ T follicular helper cell development. We anticipate that scATAC-seq will enable the unbiased discovery of gene regulatory factors across diverse biological systems.
Main
cis-acting DNA elements (for example, enhancers and promoters) and thousands of trans-acting factors (for example, transcription factors (TFs)).
To systematically benchmark the performance of this method, we analyzed primary cells in two biological contexts. First, we mapped the single-cell chromatin accessibility landscape of blood formation in bone marrow and blood samples from healthy humans, which revealed chromatin states of progenitor cells and the regulatory trajectories of their differentiation into effector cell types. Second, we performed scATAC-seq in primary tumor biopsies from patients with basal cell carcinoma (BCC) receiving anti-programmed cell death protein 1 (PD-1) immunotherapy (PD-1 blockade).
Single-cell deconvolution of the tumor microenvironment (TME) revealed distinct types of immune, stromal and malignant cells, and analysis of intratumoral T cells identified regulators of therapy-responsive T cell subtypes, including CD8+ exhausted (TEx) and CD4+ T follicular helper (Tfh) cells.
Results
Droplet-based platform for scATAC-seq
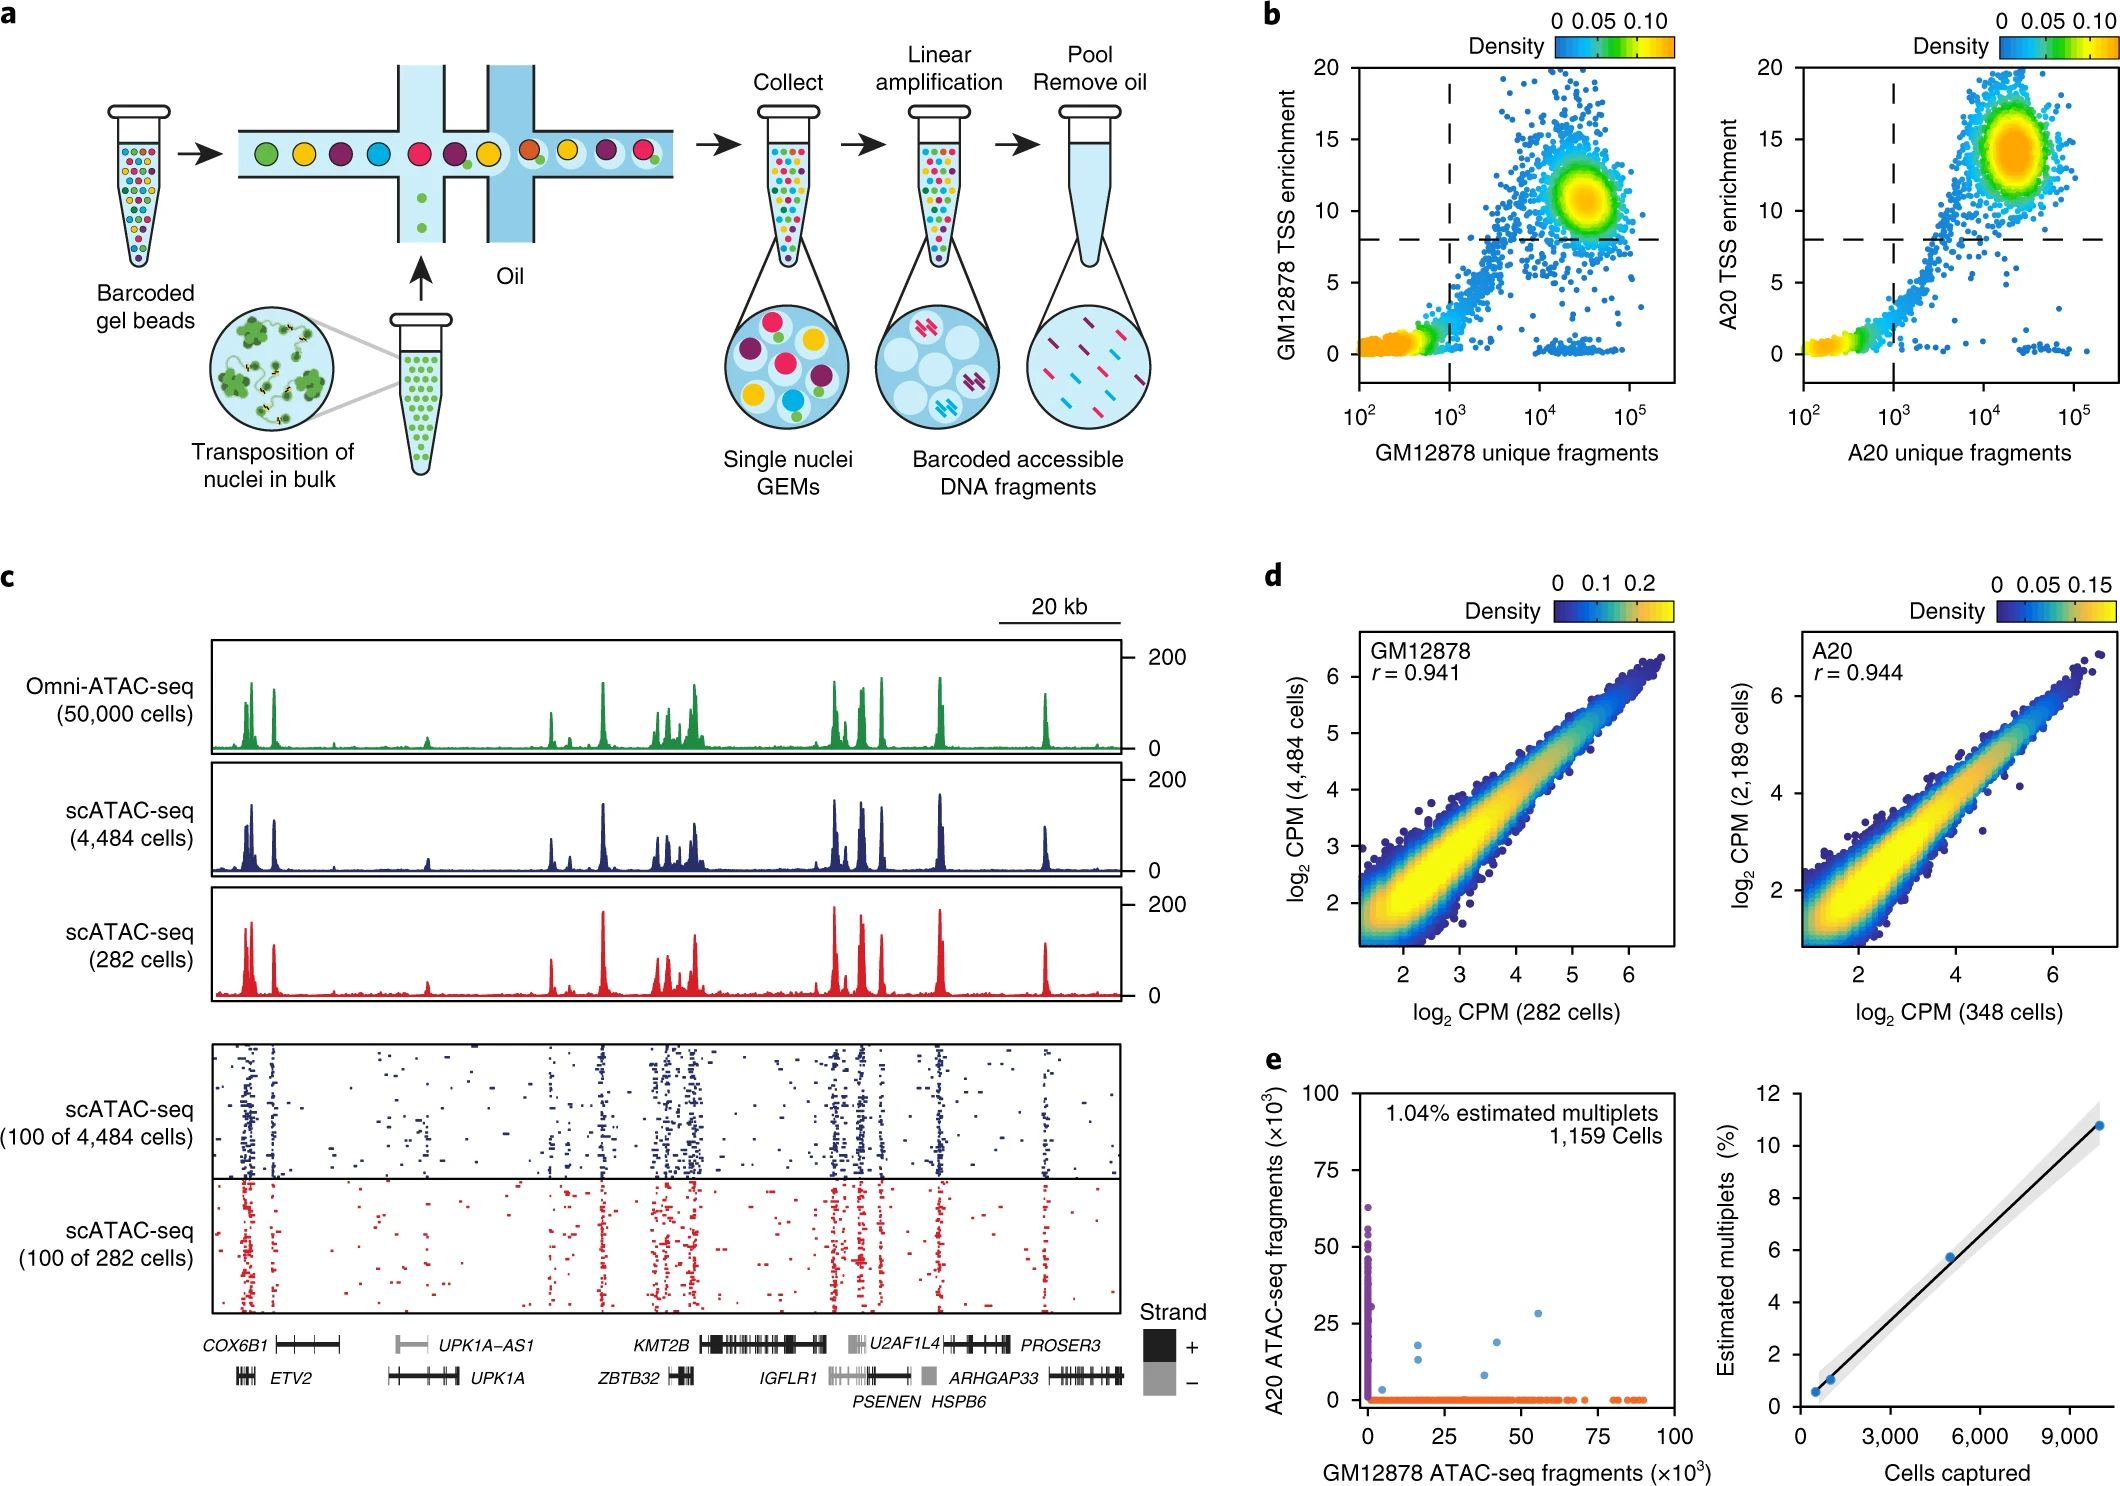
Fig. 1: Massively parallel scATAC-seq in droplets.
a, Schematic of scATAC-seq in droplets. b, ATAC-seq data quality control filters in human (GM12878) and mouse (A20) B cells at 5,000 cell loading. Shown are the number of unique ATAC-seq nuclear fragments in each single cell (each dot) compared with TSS enrichment of all fragments in that cell. Dashed lines represent the filters for high-quality single-cell data (1,000 unique nuclear fragments and TSS score greater than or equal to 8). Density is given in arbitrary units. Data are representative of four independent experiments. c, Genome tracks showing the comparison of aggregate scATAC-seq profiles with bulk Omni-ATAC-seq profiles from GM12878 B lymphoblasts (top panel). scATAC-seq profiles were obtained from 2 independent mixing experiments, in which either 4,484 (from 10,000 cell loading) or 282 (from 500 cell loading) cells were assayed, as indicated. The bottom panel shows accessibility profiles of 100 random single GM12878 cells from each experiment. Each pixel represents a 100-bp region. d, One-to-one plots of log-normalized reads in ATAC-seq peaks in aggregate scATAC-seq profiles (n = 100,000 ATAC-seq peaks, Pearson correlation). Aggregate profiles in GM12878 (left) and A20 (right) cells are derived from two individual mixing experiments as in b, in which the indicated numbers of cells were assayed. ATAC-seq peaks were identified in Omni-ATAC-seq profiles from 50,000 cells5. e, Human (GM12878)/mouse (A20) cell mixing experiment showing proportion of single-cell libraries with both mouse and human ATAC-seq fragments (left). The right panel shows proportion of mouse/human multiplets detected when cell-loading concentration was varied (n = 4 biologically independent experiments). The center line indicates linear fit, and shaded lines indicate 95% confidence interval.
8月31日
Single-cell CAS-seq reveals a class of short PIWI-interacting RNAs in human oocytes
主讲人:陈志荣
Ligang Wu
State Key Laboratory of Molecular Biology, CAS Center for Excellence in Molecular Cell Science, Institute of Biochemistry and Cell Biology, Chinese Academy of Sciences, University of Chinese Academy of Sciences, Shanghai, 200031, China
Integrative single-cell and cell-free plasma RNA transcriptomics elucidates placental cellular dynamics
主讲人:郑凌伶
Yuk Ming Dennis Lo
Li Ka Shing Institute of Health Sciences, The Chinese University of Hong Kong, Shatin, New Territories, Hong Kong SAR, China;bDepartment of Chemical Pathology, The Chinese University of Hong Kong, Shatin, New Territories, Hong Kong SAR, China;
Significance
The human placenta is a dynamic and cellular heterogeneous organ, which is critical in fetomaternal homeostasis and the development of preeclampsia. Previous work has shown that placenta-derived cell-free RNA increases during pregnancy. We applied large-scale microfluidic single-cell transcriptomic technology to comprehensively characterize cellular heterogeneity of the human placentas and identified multiple placental cell-type–specific gene signatures. Analysis of the cellular signature expression in maternal plasma enabled noninvasive delineation of the cellular dynamics of the placenta during pregnancy and the elucidation of extravillous trophoblastic dysfunction in early preeclampsia.
Abstract
The human placenta is a dynamic and heterogeneous organ critical in the establishment of the fetomaternal interface and the maintenance of gestational well-being. It is also the major source of cell-free fetal nucleic acids in the maternal circulation. Placental dysfunction contributes to significant complications, such as preeclampsia, a potentially lethal hypertensive disorder during pregnancy. Previous studies have identified significant changes in the expression profiles of preeclamptic placentas using whole-tissue analysis. Moreover, studies have shown increased levels of targeted RNA transcripts, overall and placental contributions in maternal cell-free nucleic acids during pregnancy progression and gestational complications, but it remains infeasible to noninvasively delineate placental cellular dynamics and dysfunction at the cellular level using maternal cell-free nucleic acid analysis. In this study, we addressed this issue by first dissecting the cellular heterogeneity of the human placenta and defined individual cell-type–specific gene signatures by analyzing more than 24,000 nonmarker selected cells from full-term and early preeclamptic placentas using large-scale microfluidic single-cell transcriptomic technology. Our dataset identified diverse cellular subtypes in the human placenta and enabled reconstruction of the trophoblast differentiation trajectory. Through integrative analysis with maternal plasma cell-free RNA, we resolved the longitudinal cellular dynamics of hematopoietic and placental cells in pregnancy progression. Furthermore, we were able to noninvasively uncover the cellular dysfunction of extravillous trophoblasts in early preeclamptic placentas. Our work showed the potential of integrating transcriptomic information derived from single cells into the interpretation of cell-free plasma RNA, enabling the noninvasive elucidation of cellular dynamics in complex pathological conditions.
Introduction
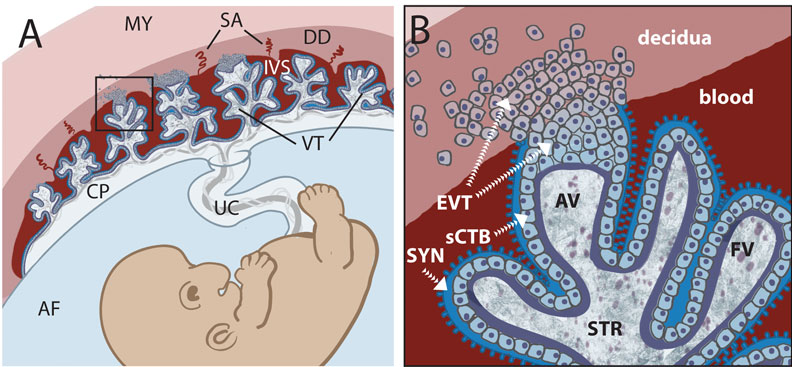
The placenta plays an essential role in the establishment of the fetomaternal interface and the maintenance of fetal homeostasis during pregnancy (1). It is a heterogeneous organ composed of cells of maternal and fetal origins, organized in multilobulated villous units.
The multinucleated syncytiotrophoblast (SCTB) layer (合胞体滋养层) on top of villous cytotrophoblasts (VCTBs) (绒毛细胞滋养层) is in direct contact with maternal blood.
The entire placental villous structure is supported by stromal cells containing fetal macrophages (Hofbauer cells) and is perfused by the fetal capillary vasculature.
A distinct type of trophoblast cells, the extravillous trophoblasts (EVTBs) (绒毛外滋养层细胞), infiltrates the maternal decidua(蜕膜) in a unique process of “controlled invasion” to remodel the maternal uterine spiral arteries and interact with maternal lymphocytes to prevent allorejection of the fetus. Placental cellular dysfunction, therefore, contributes to major gestational complications, such as preeclampsia (PE) (2).

Mannelli C, Ietta F, Avanzati AM, Skarzynski D, Paulesu L. Biological Tools to
Study the Effects of Environmental Contaminants at the Feto-Maternal Interface.
Dose Response. 2015 Nov 12;13(4):1559325815611902. doi: 10.1177/1559325815611902.
eCollection 2015 Oct-Dec. Review. PubMed PMID: 26740808; PubMed Central PMCID:
PMC4679191.
https://embryology.med.unsw.edu.au/embryology/index.php/Trophoblast
胎盘组织的主体是叶状绒毛膜,像树干一样发出绒毛分支,绒毛干是胎儿脐血管分支,围绕绒毛干的绒毛是滋养细胞细胞分裂分化而成。绒毛干及分支形成胎盘小叶,胎盘由众多小叶组成。这些绒毛之间的间隙充满母亲血液。
Despite the clinical significance of the placenta, direct tissue monitoring of the placenta of women with placental pathologies has not been feasible because of safety concerns associated with invasive placental tissue sampling. Instead, ultrasonography (超声) and maternal serum protein markers have been pursued to noninvasively monitor placental function during pregnancy (3, 4). It has been shown that the placenta is the major source of circulating cell-free fetal nucleic acids in maternal plasma (5⇓–7). Significantly elevated levels of total cell-free DNA and selected placenta-specific RNA transcripts have also been reported in the maternal plasma of women with PE (8⇓⇓–11), restricted fetal growth (12), and preterm birth (13⇓–15), supporting a role for cell-free nucleic acids as a noninvasive tool for placental monitoring. Previous studies have attempted to provide a comprehensive assessment of maternal plasma nucleic acids by microarray analysis, massively parallel transcriptomic, or methylomic sequencing (16⇓⇓⇓⇓⇓–22). Several groups have explored the use of fetal-specific DNA polymorphisms, organ-specific DNA methylation (21), nucleosome footprinting (23), DNA fragmentation patterns (24), and tissue-specific RNA transcripts (19, 20) to isolate the placental signal in the pool of circulating cell-free fetal nucleic acids and obtain changes of overall placental contribution. Nevertheless, these approaches have a low resolution in examining the dynamics of the different fetal and maternal components in the placenta and differentiating the specific pathological changes of the placenta in different gestational pathologies at the cellular level.
To address these challenges, we explored the use of microfluidic single-cell digital transcriptomic technology to comprehensively characterize the transcriptomic heterogeneity of the human placenta. We analyzed, in an unbiased manner, the single-cell transcriptomes of more than 24,000 nonmarker-selected placental cells from normal and early PE placentas. PE is a potentially lethal gestational condition characterized by new onset of hypertension and proteinuria at ≥20 wk of gestation. It is a leading cause of maternal and perinatal morbidity and mortality. Defective placental implantation has been proposed as the major pathological mechanism in early PE occurring before 34 wk of gestation (2, 25), and previous studies based on whole-tissue profiling have reported extensive changes in the gene-expression profiles of preeclamptic placentas (26, 27).
Using the comprehensive single-cell dataset, we first showed that individual placental cellular components can be monitored through the aggregated signals of sets of highly cell-type–specific signature genes, which revealed the longitudinal cellular dynamics in maternal plasma during pregnancy progression. This approach also allows the identification of the EVTB pathology in early PE placentas from maternal plasma cell-free RNA. Our study showed the potential of an integrative and synergistic analytical approach of single-cell and cell-free RNA transcriptomic studies.
Results
Dissection of the Cellular Heterogeneity of the Human Placenta.

Fig. 1.Single-cell transcriptomic profiling and the dissection of the cellular heterogeneity of human placenta. (A) Schematic diagram showing the experimental design in this study. Cellular heterogeneity of the human placenta is dissected by large-scale droplet-based single-cell transcriptomic profiling. Cell-type–specific signatures of different types of placental cells are identified and used to obtain information of cellular dynamics in the maternal plasma RNA profiles in pregnancy and PE. (B) Biaxial scatter plot showing single-cell transcriptomic clustering of placental cells from human term placentas by t-SNE analysis. Cells were further grouped into specific subgroups (P1–P12) and colored individually based on expression patterns of specific marker genes and spatial proximity in the biaxial plot. (C) Column chart comparing the fraction of maternal or fetal cells in each cellular subgroup. (D) Column chart indicating the percentage of cells expressing Y chromosome-encoded genes in each cellular subgroup. (E) Biaxial scatter plots showing the expression pattern of specific genes among different subgroups of placental cells.
We collected placental parenchymal(实质) biopsies at defined locations of multiple freshly Cesarean section-delivered placentas (from two male and two female babies) and dissociated the tissues into single-cell suspension without surface marker preselection. We obtained the single-cell transcriptome of 20,518 placental cells from six different full-term placenta parenchymal biopsies. The average number of genes detected per libraries was 1,006 (792–1,333), with a mean coverage of 21,471 (16,613–36,829) reads per cell (Table S1).
Table S1.
Descriptive statistics of the single-cell libraries
| Single-cell placental libraries | ||||||||||
|---|---|---|---|---|---|---|---|---|---|---|
| PN1 | PN2 | PN3C | PN3P | PN4C | PN4P | PE1 | PE2 | PE3 | PE4 | |
| Sample identification | M12475 | M12491 | M12548 | M12551 | M12604 | M12630 | M12632 | M12612 | ||
| Sampling distance relative to cord insertion | 5 cm | 5 cm | 5 cm | Placenta periphery | 5 cm | Placenta periphery | 5 cm | 5 cm | 5 cm | 5 cm |
| No. of valid cells in library | 3,151 | 7,621 | 2,754 | 1,391 | 2,653 | 2,948 | 5,849 | 2,294 | 4,669 | 5,167 |
| Mean raw reads per cell | 44,184.5 | 36,732.4 | 34,365 | 64,729.6 | 26,200.2 | 20,430.2 | 36,319 | 68,860 | 19,309 | 33,971 |
| Mean mapped reads per cell | 22,710 | 19,016.5 | 20,708.4 | 36,829.1 | 16,613.4 | 12,949.1 | 22,990 | 41,178.3 | 12,512.2 | 20,654.4 |
| Median genes per cell | 1,031 | 1,333 | 1,019 | 792 | 922 | 939 | 1,537 | 1,145 | 1,133 | 1,468 |
| Gestational age, wk | 38 | 38 | 38+2 | 38+2 | 38 | 38 | 31+2 | 32+4 | 29+6 | 28+1 |
Our analysis showed that all clusters, except P1, P6, P8, and P9, were of predominant fetal origin (Fig. 1 C and D). P1 transcriptionally corresponded to maternal decidual cells, with strong expression of DKK1, IGFBP1, and PRL (Fig. 1E); P6 expressed dendritic markers CD14, CD52, CD83, and CD86, likely representing maternal uterine dendritic cells (Fig. 1E). Meanwhile, P8 expressed high levels of T-lymphocyte markers (e.g., CD3G and GZMA) (Fig. 1E). The fetomaternal SNP ratio analysis suggested that P8 was a mixture of both fetal and maternal lymphocytes (Fig. 1 C and D). Similarly, the homogeneous expression of adult and fetal hemoglobin genes, such as HBA1, HBB, and HBG1, and the gene encoding the heme biosynthetic enzyme ALAS2 in P9 suggested that they were composed of erythrocytic cells from the fetal cord and from a maternal source.
The rest of the fetal subgroups (P2–P5, P7, and P10–P12) could be broadly classified into four groups [i.e., vascular (P2 and P3), stromal (P4), macrophage-like (P5 and P7), and trophoblastic (P10–P12) cells] (Fig. S1B). P2 cells commonly expressed vascular endothelial genes (e.g., CD34, PLVAP, CDH5, and ICAM1) (Fig. 1E). A few endothelial cells of maternal origin could also be found in the P2 cluster (Fig. S1A). P3 cells showed features of vascular smooth muscle cells, with expression of MYH11 and CNN1 (Fig. 1E). The large cluster of P4 cells expressed mRNAs of the ECM1 protein and fibromodulin, both of which were markers of villous stromal cells. Similar to maternal P6 cells, fetal P5 and P7 clusters also highly expressed activated monocyte/macrophage-specific genes CD14, CSF1R (encoding CD115), CD53, and AIF1 (Fig. 1E). Nonetheless, fetal P5 and P7 subgroups showed additional expression of CD163 and CD209, both being markers of placental resident macrophages (Hofbauer cells) (Fig. 1E). Comparing with P7 cells, the P5 subgroups also showed prevalent expression of fibroblastic and mesenchymal genes shared with P4 villous stromal cells, such as THY1 (encoding CD90), collagen genes (COL3A1 and COL1A1), and VIM (Fig. S1C). These results raised the possibility that the P5 subgroup may be composed of duplets of P4 and P7 cells during single-cell encapsulation. To corroborate this hypothesis, we performed in silico duplet simulation analysis (Fig. S1D), and our result indicated that the P5 cells closely resembled the simulated data and hence, likely represented artificial duplets.

Fig. S1.Dissection of the cellular heterogeneity and annotation of cellular identity in the human placenta. (A) Biaxial scatter plot showing the distribution of cells of predicted fetal/maternal origin in the original t-SNE clustering distribution as in Fig. 1B. Data from PN2 libraries have not been plotted, as no genotyping information was available for fetomaternal origin prediction. (B) The four major cellular groups in the human placenta: decidual (蜕膜) (P1; green), stromal (基质) (P2–P4; olive), hematopoietic (造血) (P5–P9; red), and trophoblastic (滋养层) (P10–P12; turquoise). (C) Expression pattern of stromal (COL1A1, COL3A1, THY1, and VIM) and myeloid (CSF1R, CD14, AIF1, and CD53) markers in P5–P7 subgroups. (D) t-SNE analysis showed clustering of P5 cells (gray) with artificial P4/P7 duplets (light green) generated in silico, suggesting that P5 cells are likely multiplets. (E) Biaxial scatter plots showing the expression pattern of genes encoding for HLAs among different subgroups of placental cells. (F) Cellular subgroup composition heterogeneity in different single-cell transcriptomic datasets. PN3P/PN3C and PN4P/PN4C represent paired biopsies taken proximal to the umbilical cord insertion sites (PN3C/PN4C) and distal at the periphery of the placental disk (PN3P/PN4P). (G) Table summarizing the annotated nature of each cellular subgroup.
The trophoblastic clusters (P10–P12) could be divided into three subgroups [i.e., EVTBs (P10), VCTBs (P11), and SCTBs (P12)], with distinctive expression patterns of PAPPA2, PARP1, and CGA, respectively (Fig. 1E). Genes involved in the production of important gestational hormones, including CYP19A1 (encoding aromatase for estrogen synthesis), CGA (human CG), and GH2 (human placental growth hormone), were all specifically expressed in P12 (SCTBs) (Fig. 1E). It is known that placental EVTBs expressed nonclassical form of HLAs, such as HLA-G, to promote maternal immunotolerance of the fetus with uterine natural killer cells (29⇓–31). Indeed, we detected strong expression of HLA-G in the EVTBs (P10) subgroup (Fig. S1E). Expression of HLA genes in VCTBs and SCTBs was generally scarce, whereas classical HLA-A is specifically expressed in nontrophoblast cells (P1–P9). Expression of genes encoding the HLA class II molecules, such as HLA-DP, HLA-DQ, and HLA-DR, was concentrated in P6 and P7, which was consistent with the antigen-presenting functions in the maternal dendritic cells and fetal macrophages.
Previous bulk tissue transcriptomic profiling has shown significant spatial heterogeneity between biopsies taken from different sites of the placenta (32). Comparison of the compositional heterogeneity of different libraries in our dataset also reflected such variations (Fig. S1F). We included two paired biopsies of the placental parenchyma at sites proximal (PN3C and PN4C) and distal (PN3P and PN4P) to the umbilical cord insertion from two different individuals (Table S1). We found that P1 decidual cells were significantly underrepresented in the PN1 library compared with others. Instead, the P2 fetal endothelial cells fraction was significantly higher in PN1 than other libraries, suggesting high contribution from the umbilical vasculature on the fetal surface of the placenta in the PN1 biopsy. In contrast, the PN2 library contained the highest fraction of P1 decidual cells, P6 maternal uterine dendritic cells, and P10 EVTBs. The PN2 library likely captured more cells at the deeper fetomaternal interface. Cellular compositions of biopsies obtained from paired proximal and distal middle sections were more comparable, with only significant reduction in decidual cells, and increased in EVTBs at the distal site, but the interindividual variation remained high (Fig. S1F). These findings highlighted the cellular heterogeneity in the placenta and the necessities of a single-cell analytical approach.
In short, our dataset delineated 11 transcriptomically and genetically distinct major cellular subtypes in the human placenta (Fig. S1G).
Reconstructing the Cellular Relationship of Trophoblasts.
Our dataset captured a significant number of trophoblastic cells (7,450; 36%). We observed that the P10–P12 subgroups clustered in continuum, despite the clear topological expression of certain trophoblast subtype markers (Fig. 1 B and C). In fact, it has been proposed that these trophoblast subtypes are developmentally connected: VCTBs (P11) are the progenitor compartment for the generation of EVTBs (P10) by decidual invasion and SCTBs (P12) by syncytium formation during placental development.
To delineate this relationship transcriptomically and to study the genes that regulate this process, we first identified the highly variable genes among these three clusters for t-SNE reclustering analysis (Fig. 2A, Inset i). In such analysis, multiple smaller new clusters emerged (Fig. 2A, Inset ii). We then ordered individual trophoblast cells computationally in a 2D “pseudotime” trajectory following the method described by Trapnell et al. (33) to reconstruct their differentiation relationship. We found that the trophoblasts formed a continuous “u-shaped” trajectory (Fig. 2A), with EVTB (P10) and SCTB (P12) cells occupying the two heads and VCTBs (P11) at the turn and tail. The villous SCTB branch further bifurcated into two subbranches (Fig. 2A). One subbranch was occupied by cells expressing high levels of gestational hormone genes, GH2 and CGB, whereas the other one showed strong expression of genes involved in cell fusion. Endogenous retroviral transcripts (ERVs) are involved in syncytial cell fusion (多核体细胞融合) [e.g., ERVW-1 (syncytin-1), ERVFRD-1 (syncytin-2), and ERVV-1] and increased along the SCTB differentiation pathway (34) (Fig. 2B and Fig. S2). In contrast, another ERV transcript, ERVH48-1, is depleted in SCTBs (Fig. 2B), concordant with a recent report that it functions as an inhibitor of syncytium formation in VCTBs (35). To further study the cell fusion process, we identified genes that showed variation similar to ERVFRD-1 along the SCTB pathway (Fig. S2). These included an SCTB invasion suppressor (MUC15) (36), a member of the placental galactin family (LGALS13), and a direct gene target of ERVs (INSL4) (37). We also identified multiple genes (e.g., OMG, SLC1A2, ADHFE1, and DEPDC1B) as potential regulators in SCTB development, laying ground for function characterization in future studies.


Fig. S2.Pseudotemporal change of gene expression in trophoblasts. Genes were organized into two major groups by their similar pseudotemporal covariation of expression. Notable gene examples involved in trophoblast development were marked and enlarged.
Pseudotime analysis of the EVTB developmental pathway also revealed specific up-regulation of various extracellular enzymes involved in the invasive and migratory phenotype of EVTBs [e.g., proteinases and their regulators (MMP11 and TIMP1), nuclease (DNASE1L3), ECM (SPON2), and migration inhibitor (GKN1)] (38) (Fig. 2B and Fig. S2). Minor branches stemming from the area occupied by P11 VCTB cells were lined by cells with high expression of genes involved in cell division (e.g., CCNB1, TOP2A, MKI67, and CENPF). These minor branches likely represented entry to the cell cycle of proliferative VCTBs in the process of EVTB differentiation. In contrast, proliferative(增殖) cells were scarce along the SCTB pathways, consistent with their nondividing nature (Fig. 2B). In short, our dataset enabled the delineation of the trophoblast lineage relationship and shed light on the regulatory mechanism of lineage development.
Noninvasive Elucidation of Placental Cellular Dynamics During Pregnancy.
Previous maternal plasma transcriptomic profiling studies have shown that certain trophoblast-specific transcripts and the overall fractional placental contribution increase with gestation (20, 39, 40). The fraction of fetal-derived RNA increases from only 3.7% in early pregnancy to 11.28% in late pregnancy (19, 20). We reasoned that establishment of the cell-type–specific gene signatures at the single-placental cell level would allow us to isolate and dissect the dynamic changes of both trophoblastic and nontrophoblastic cellular components in the maternal plasma. However, it is known that fetal-derived cell-free RNA in maternal plasma circulates in mixture with cell-free RNA derived from the maternal hematopoietic system. Liver-specific transcripts, such as ALB, are also readily detectable in the plasma (41). We, therefore, identified and filtered the cell signature genes of individual placental cell types in our dataset by reanalyzing peripheral blood mononucleated cells (PBMCs) single-cell transcriptomic profiles and the tissue transcriptome data of leukocytes and liver from public databases (28, 42) (Fig. S3 A–E).


Fig. S3.Identification of cell-type–specific signature genes sets and noninvasive elucidation of placental cellular dynamic in maternal cell-free RNA. (A) Biaxial t-SNE plot showing the clustering pattern of PBMCs and placental cells. The PBMC data (donor B) from Zheng et al. (28) were plotted with the placental dataset. (B) Table summarizing the annotated nature of each cellular subgroup in the placenta/PBMC merged dataset. (C) Biaxial scatter plots showing the expression pattern of specific marker genes among different subgroups of placental cells and PBMCs. (D) Heat map showing the average expression of cell-type–specific signature genes in different PBMCs and placental cells clusters. The column side color corresponds to the cell cluster coloring in A. The row side color indicates the cell-type specificity of the gene. (E) Box plots comparing the expression levels of different cell-type–specific signature genes in human leukocytes, the liver, and the placenta. (F) Cell signature expression analysis of the maternal plasma RNA profiles of Koh et al. (20). Line plots showing the change of the average expression of individual cell-type–specific signature in different stages of pregnancy with respective to first trimester maternal plasma. The gray lines demarcate the range of the data. FPKM, fragments per kilobase of transcript per million mapped reads.
We then studied the expression dynamics of the corresponding cell-type–specific signature in the maternal plasma RNA profiles from different stages of pregnancy by Tsui et al. (19). In the dataset by Tsui et al. (19), we observed a dramatic up-regulation of SCTB signature in the maternal plasma RNA of early pregnancy compared with nonpregnant controls (Fig. 3). The trend peaked at predelivery maternal plasma before rapidly dropping to levels of nonpregnant controls 24 h after delivery. A similar pattern could also be found in the trophoblastic EVTB, placental stromal cell, and vascular smooth muscle cell signatures. These patterns corresponded to the rapid growth of the stromal, SCTB, and EVTB components of the placenta in early pregnancy and its clearance after placental delivery. Meanwhile, the change of the gene signature expression of endothelial cell is minimal. Intriguingly, the signature of decidual cells remained observable in maternal plasma up to 24 h after delivery. This can be explained by the fact that release of cell-free RNA from residual maternal decidual tissues degeneration may continue after placental delivery. In contrast, we found that the signature of B cell continued to drop throughout pregnancy, whereas signature of T cell first dropped and then recovered to nonpregnant levels before delivery. Consistently, previous studies on pregnancy-associated lymphopenia by flow cytometry have shown that T- and B-cell levels decline with the progression of pregnancy (43⇓–45) and that recovery of peripheral B-cell levels may occur later than those for T cells (44). Meanwhile, the signature of monocytes showed a more variable pattern, up-regulating in early pregnancy, dipping, and rebounding before delivery, in line with the findings of myeloid immunity activation during pregnancy (43, 46⇓–48). To further confirm these findings, we reanalyzed another independent maternal plasma RNA dataset by Koh et al. (20) collected at three trimesters of pregnancy and within 6-wk postpartum. We observed dynamic patterns of cell signature consistent with what we had found in the dataset by Tsui et al. (19) (Fig. S3F). These findings showed the ability of cell-type–specific signatures analysis to dissect the dynamics of individual cellular components in the maternal plasma RNA profiles.

Fig. 3.Elucidation of placental cellular dynamic in maternal plasma RNA profiles during pregnancy. Line plots showing the change of the average cell signature expression of individual placental cell type in different gestational groups. The maternal plasma RNA profiles were retrieved from Tsui et al. (19). The gray lines demarcate the range of the data. I, early pregnancy (13–20 wk); II, mid/late pregnancy (24–30 wk); III, predelivery; NP, nonpregnant; PP, 24-h postpartum.
Deciphering Cellular Aberrations in Preeclamptic Placentas from Maternal Plasma Cell-Free RNA.
We next expanded our study to uncover the placental cellular dysfunction in the maternal cell-free RNA of early severe preeclamptic patients. We reasoned that cellular pathology in the preeclamptic placentas affects the cell turnover and hence, the release of the cell-type–specific RNAs into the maternal plasma. The cellular origin of the pathology can, therefore, be revealed by comparing the expression levels of different cell-type–specific signatures in the maternal plasma of early severe preeclamptic patients with those of healthy pregnant controls.
Strikingly, we found that the EVTB signature is specifically and consistently up-regulated in early severe preeclamptic patients in two separate cohorts assayed with different plasma RNA library preparation chemistries (P = 0.042, two-tailed two-sample Wilcoxon signed rank test) (Fig. 4A and Fig. S4A). These results pointed to an increased release of EVTB-derived cell-free RNA into the maternal circulation in early PE. We then validated this finding directly at the tissue level. We characterized the single-cell transcriptome of placental biopsies from four of the early preeclamptic patients and compared the intracluster transcriptomic heterogeneity in the EVTB clusters between normal-term and early preeclamptic placentas to reveal the abnormalities in different biological processes (Fig. S4B). As gene-expression heterogeneity decreased with increasing expression levels (49, 50) (Fig. S4C), we quantified the expression heterogeneity of each gene as the vertical distance of its squared coefficient of variations (CV2) from the median CV2[distance to median (DM)] at its corresponding expression level in a double log-transformed space (50). We compared the DM values of gene sets annotated in different gene ontology (GO) terms between PE and normal-term placental EVTBs to identify differential biological processes (Fig. S4C); we observed that the transcriptional heterogeneity of genes involved in cell migration, cell death, and proliferation is significantly more variable in early preeclamptic placentas, whereas DNA damage repair and antigen presentation ontology terms are more variable in term placentas (Fig. 4 B and C). Indeed, genes annotated in “cell death” showed not only higher expression variability but also, higher levels of gene expression in early preeclamptic EVTBs (Fig. 4C). Alternative gene set enrichment analysis (51) also supported significant enrichment of expression of cell death-related genes in the preeclamptic EVTB cluster (Fig. S4D). These results suggested that EVTB in early preeclamptic placentas might have higher levels of cell death. This conclusion is in line with previous reports that trophoblastic apoptosis is increased in PE (52⇓⇓⇓⇓⇓⇓–59). Despite the invasion insufficiency of EVTB in PE, the increased cell death in EVTB may also contribute to the up-regulation of the EVTB signatures in the maternal plasma of early preeclamptic patients. In short, we showed the ability of plasma cell-free RNA cellular signature analysis, with early PE as an example, to serve as a noninvasive hypothesis-free exploratory tool in revealing hidden cellular pathology of a complex organ and to provide a potential noninvasive approach for molecular testing of PE.

Fig. 4.Uncovering placental cellular aberrations in early preeclamptic maternal plasma RNA profiles. (A) Box plot comparing the cell signature expression of different cell types in the maternal plasma RNA profiles of third trimester pregnancy (control) and early PE patients. Statistical testing was performed by two-tailed two-sample Wilcoxon signed rank test. (B) Biaxial scatter plot showing the average single-cell expression heterogeneity of different GO annotated gene sets in third trimester term and early preeclamptic placentas. Only data points with statistically significant differences are shown (P < 0.05). GO terms associated with cell proliferation, cell migration, apoptosis, antigen presentation, and DNA damages are colored and highlighted. (C) Violin plots comparing the expression level-corrected heterogeneity (DM values) and average expression levels of genes annotated in the GO term “Cell Death” between PE patients and normal controls.

Fig. S4.Noninvasive detection of cellular aberrations in early preeclamptic placentas. (A) Box plot comparing the cell signature expression of decidual cells, placental endothelial cells, EVTB cells, and SCTB cells in the maternal plasma RNA profiles of third trimester pregnancy (control) and early preeclamptic patients (PE) from a separate small cohort assayed using the RNA library preparation method as described by Tsui et al. (19). (B) Biaxial scatter plots showing the trophoblast clusters in the merged PE/control placenta single-cell transcriptomic dataset and the expression of EVTB marker genes HLA-G, PAPPA2, TIMP1, CSH1, and ADAM12. The EVTB cells from PE/control placentas are colored in light green (control) and purple pink (PE). (C) Scatter plot showing the relationship of log-transformed CV2 and log-transformed average expression levels of the cells in the EVTBs cluster: term placenta (Left) and PE (Right). The rolling medians across the expression range are plotted (orange line), and the expression level-corrected expression variability of a gene is calculated as the vertical distance of its CV2 value from the rolling median regression line (DM). (D) Gene set enrichment analysis result (51) confirming enrichment of cell death-related genes expression in early preeclamptic EVTB cells.
Discussion
The discovery of circulating cell-free fetal nucleic acids in maternal plasma has enabled the development of noninvasive prenatal diagnosis of fetal aneuploidy and monogenic diseases through detection of the pathogenic mutations, allelic imbalances, and chromosomal imbalances (60, 61). However, it remains difficult to study placental pathology using cell-free fetal nucleic acids. One difficulty is the ascertainment of the origin of RNA transcripts. It has been shown that fetal RNA in maternal plasma is placenta-derived (16, 39), and RNA transcripts derived from other fetal tissues have also been reported in maternal plasma (20). The tissue origins of these RNA transcripts are inferred from comparison of whole-tissue gene-expression profiles of multiple tissues types. However, biological tissues are composed of multiple types of cells originating from different developmental lineages and serving different specialized functions. The averaged expression profile from whole tissues may, therefore, distort the actual heterogeneous composition of the tissue and bias toward cells with the highest cell number in the tissue sample, such as the trophoblasts in the placenta. It is, therefore, imperative to connect the circulating pool of cell-free nucleic acids with their cellular origins to reveal the complex dynamics of both trophoblastic and the nontrophoblastic components of the placenta during pregnancy. The advance in single-cell transcriptomic technology provides an opportunity for us to bridge the study of the placenta with circulating cell-free nucleic acids during pregnancy.
The potential of single-cell transcriptomic analysis on placental biology can be seen in two recent small-scale studies in the mouse and human (62, 63). In this study, we harnessed the power of microfluidic single-cell transcriptomic technology to establish a large-scale cellular transcriptomic atlas of the human placenta, profiling more than 24,000 nonmarker-selected cells from normal-term and early preeclamptic placentas. We annotated the fetomaternal origin of individual cells using both genetic and transcriptional information to provide a comprehensive picture of placental cellular heterogeneity, including decidual cells, resident immune cells, and vascular and villous stromal cells. The high number of trophoblast cells recovered in our dataset allowed computational reconstruction of the trophoblastic differentiation trajectories and identification of highly specific cell signature genes. Our analysis supported a bifurcating model with VCTB differentiating bidirectionally into SCTB and EVTB (64). The trajectories recapitulated many known regulator interactions during trophoblast development and discovered potential players that laid a foundation for future investigation. Furthermore, our analysis highlighted the high degree of cellular heterogeneity among placental parenchyma biopsies, even at defined sampling locations, reinforcing the need for a single-cell approach in the transcriptomic study of the human placentas. Future bioinformatics tools can be developed to exploit the cellular transcriptomic signature established in this placental atlas to normalize cellular composition heterogeneity in whole-tissue profiles.
Finally, we showed the feasibility of integrating single-cell transcriptomic analysis with plasma-circulating RNA analysis in dissecting the complex fetal and maternal cellular dynamics during normal pregnancy progression and revealing the cellular pathology in early preeclamptic placentas noninvasively. We discovered cell-type–specific signature genes from large-scale single-cell transcriptomic profiling de novo and aggregated signals of all cell-type–specific genes to reconstruct the cellular information. With this approach, comparable cellular dynamic patterns can be observed in two independent maternal plasma RNA datasets (19, 20). The dynamic patterns of trophoblastic and hematopoietic cell types revealed are consistent with current knowledge on the hematopoietic system and the placenta during pregnancy. More importantly, this approach allowed the recovery of differential expression of the EVTB signatures in maternal plasma, which reflected the actual cellular abnormalities in early preeclamptic patients at the tissue level. As invasive placental biopsy in gestation age-matched healthy pregnant women is not feasible, we compared the post-Cesarean section placental biopsies from early preeclamptic patients with those from healthy full-term pregnancies. Since placental cell death increases with gestation progression and placental maturation (54), one would expect an even stronger difference in cell death between early preeclamptic and healthy early third trimester EVTB cells. This challenge also underlines the need of cell-free RNA cell signature analysis as a noninvasive molecular tool in exploratory in vivo studies to differentiate cellular pathology in different forms of placental dysfunction and offer clinical diagnostic information. With continuous improvement in the cost-effectiveness of large-scale single-cell transcriptomic technology and the effort of the Human Cellular Atlas Initiative in profiling the cellular transcriptomic heterogeneity of all cellular subtypes in different major human organs (28, 65⇓–67), it can be envisioned that the same analytical approach can be extended to other situations, such as intratumoral dissection in cell-free tumoral RNAs and noninvasive exploration of the cellular pathology in other gestational diseases.
In short, our study has established a large-scale single-cell transcriptomic atlas of the normal and early preeclamptic placentas and showcased the power of integrative analysis of single-cell transcriptomics and plasma cell-free RNA to reconstruct cellular information from plasma. This opens an avenue for noninvasive elucidation of cellular dynamics and aberrations in complex biological systems and molecular diagnostics.
Materials and Methods
https://blog.sciencenet.cn/blog-565558-1197227.html
上一篇:一周文献精选
下一篇:20200804=富集分析